Fig. 9
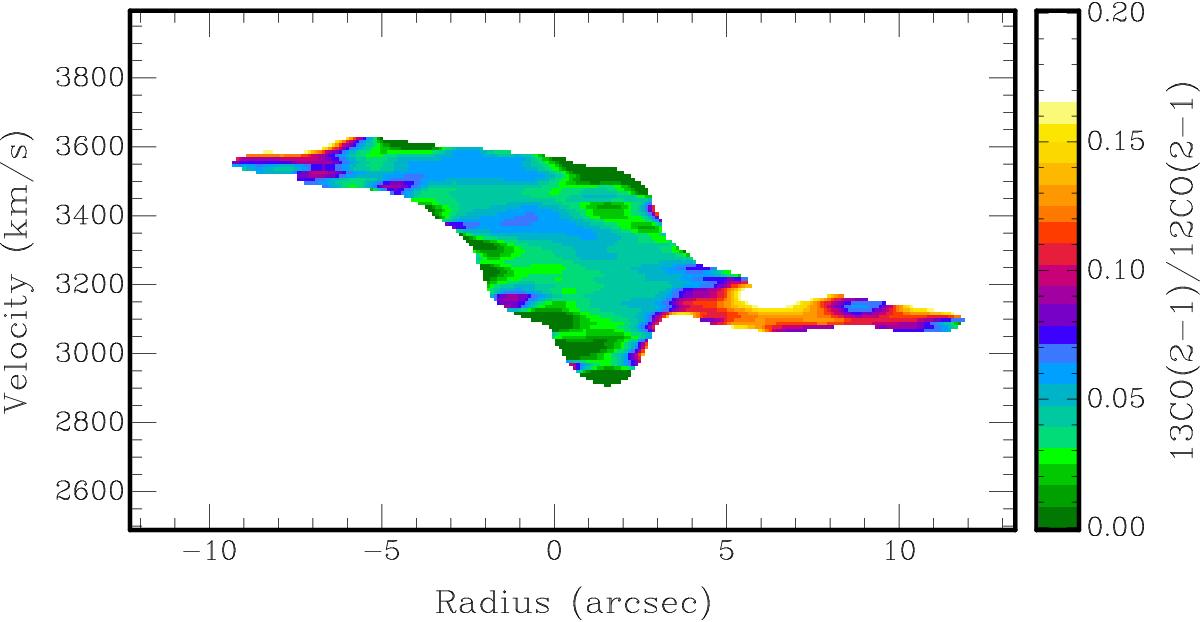
Position-velocity diagram of the ratio of the low-resolution 13CO(2–1) and 12CO(2–1) brightness temperatures along the jet axis of IC 5063 where the data, before taking the ratio, have been averaged over 1.5 arcsec perpendicular to the jet axis. Only pixels for which the error in the ratio is smaller than 0.07 are shown. For the regions in the diagram where the fast outflow is occurring, the values should be regarded as upper limits since no 13CO(2–1) emission is detected there. The spatial resolution along the jet axis is 1.̋52.
Current usage metrics show cumulative count of Article Views (full-text article views including HTML views, PDF and ePub downloads, according to the available data) and Abstracts Views on Vision4Press platform.
Data correspond to usage on the plateform after 2015. The current usage metrics is available 48-96 hours after online publication and is updated daily on week days.
Initial download of the metrics may take a while.