Fig. 6
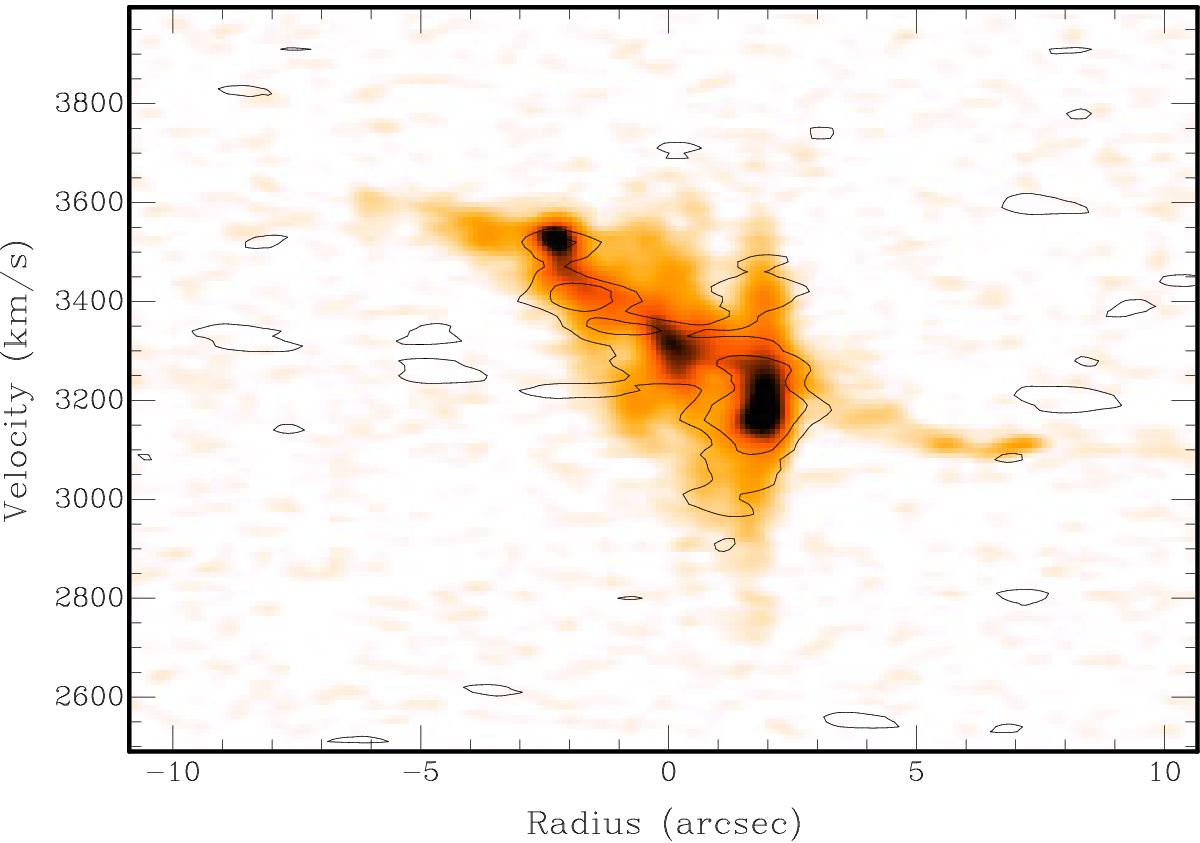
Position-velocity diagram of the low-resolution HCO+(4–3) emission (contours) along the jet axis of IC 5063 where the data have been averaged over 1.5 arcsec perpendicular to the jet axis. The greyscale is the position-velocity slice of the full-resolution CO(3–2) data. Contour levels are 6.6 (2σ) and 13.2 mK. The spatial resolution along the jet axis is 1.̋52 and the velocity resolution of the HCO+(4–3) data is 100 km s-1.
Current usage metrics show cumulative count of Article Views (full-text article views including HTML views, PDF and ePub downloads, according to the available data) and Abstracts Views on Vision4Press platform.
Data correspond to usage on the plateform after 2015. The current usage metrics is available 48-96 hours after online publication and is updated daily on week days.
Initial download of the metrics may take a while.