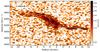
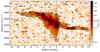
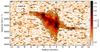
Fig. 4

Position-velocity plots along the jet axis for CO(1–0) (top), CO(2–1) (middle) and CO(3–2) (bottom) where the data have been averaged over 1.5 arcsec perpendicular to the jet axis. Contour levels are –71.25 (dashed), 71.25 (1.5σ), 142.5, 285.0, ... for the CO(1–0) data and –15 (dashed), 15 (1.5σ), 30, 60, ... mK for the other two panels. For all panels the colour stretch is the same. For display purposes, the data have not been corrected for the primary beam. The dashed vertical lines indicate the approximate extent of the radio continuum structure. Positive radii are west of the centre of IC 5063. The spatial resolution along the horizontal axis is 0.̋63. The grey curve in the top panel indicates where one would expect in this pv diagram to detect gas which follows the normal kinematics of a regularly rotating gas disk (i.e. gas not participating in the outflow; see text).
Current usage metrics show cumulative count of Article Views (full-text article views including HTML views, PDF and ePub downloads, according to the available data) and Abstracts Views on Vision4Press platform.
Data correspond to usage on the plateform after 2015. The current usage metrics is available 48-96 hours after online publication and is updated daily on week days.
Initial download of the metrics may take a while.