Fig. 11
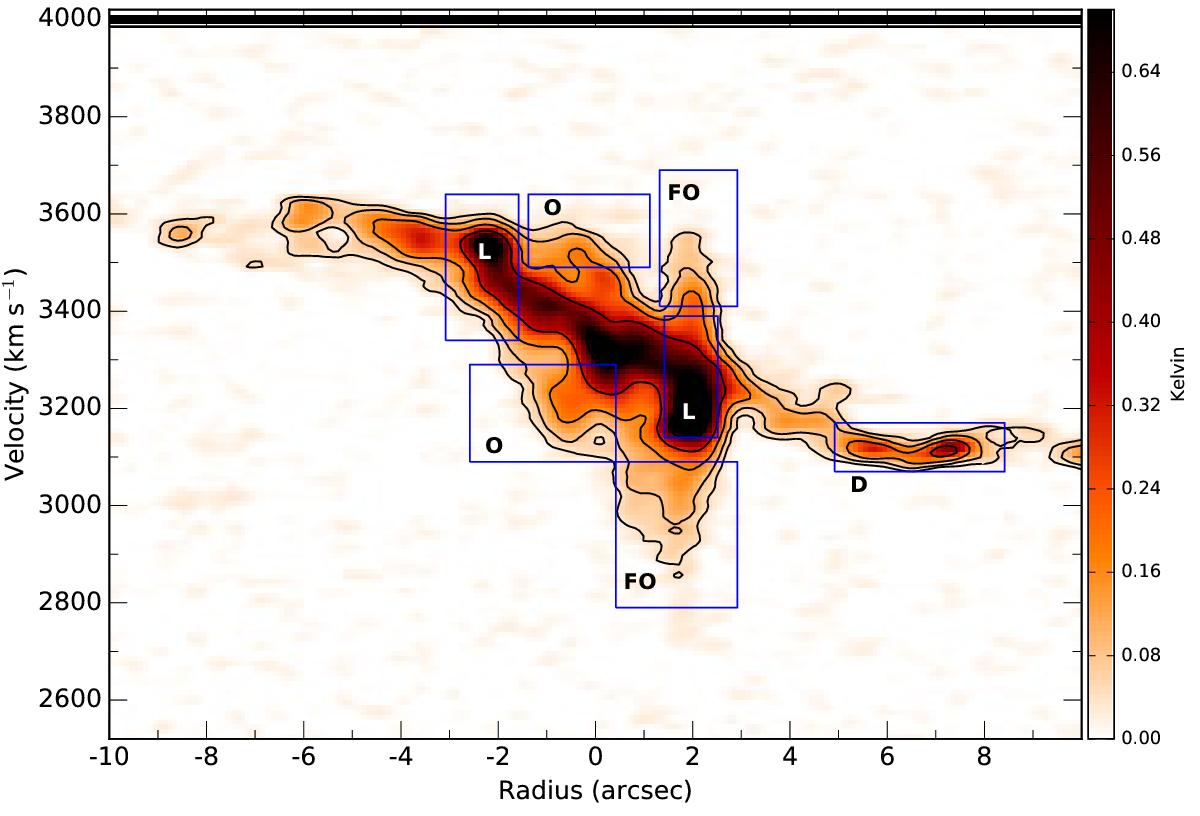
Regions for which we computed line ratios as input for the RADEX modelling. The region labelled “FO” correspond to the fast outflow at the western lobe. Region labelled “O” to the outflow in the more central regions, while region “L” to the eastern and western radio lobes at velocities close to those for regular rotation. The region labelled “D” corresponds to the outer disk. The underlying grey scale is the position-velocity diagram of the CO(2–1) emission. Contour levels are 43.75, 87.5, 175.0, and 350 mK
Current usage metrics show cumulative count of Article Views (full-text article views including HTML views, PDF and ePub downloads, according to the available data) and Abstracts Views on Vision4Press platform.
Data correspond to usage on the plateform after 2015. The current usage metrics is available 48-96 hours after online publication and is updated daily on week days.
Initial download of the metrics may take a while.