Fig. 1
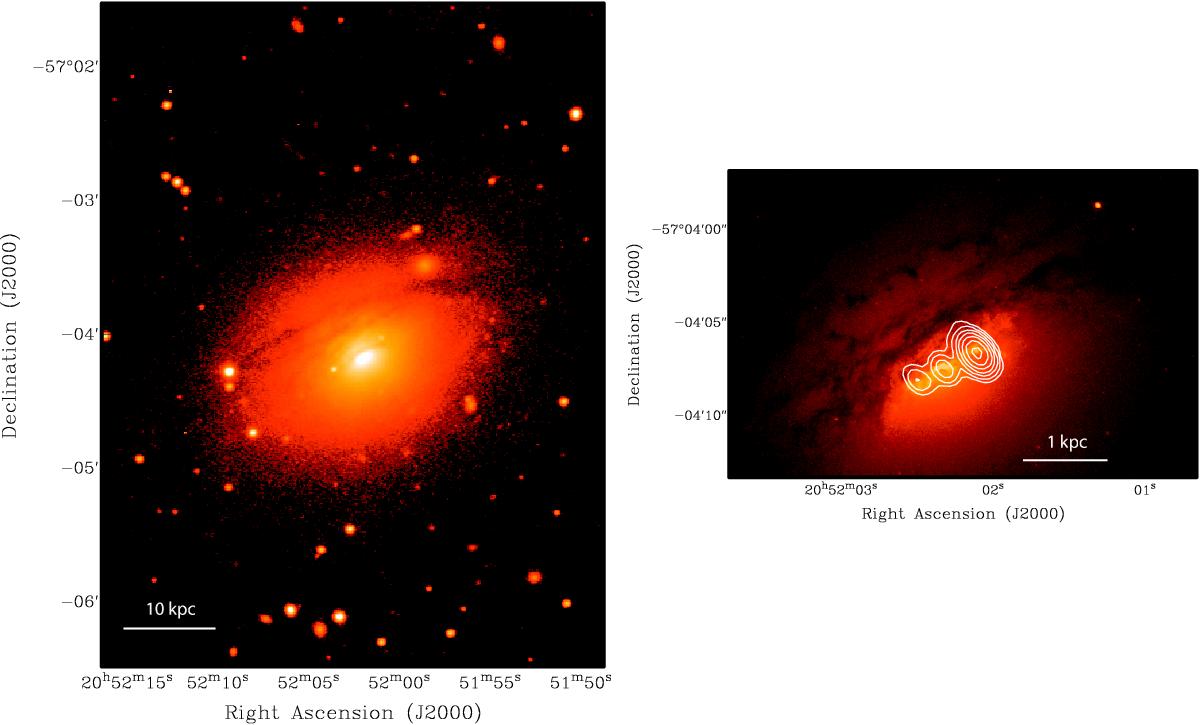
Left: optical image of IC 5063. This image is taken, using EFOSC on the ESO 3.6-m telescope, through a narrow-band filter centred on 5100 Å, and shows the large-scale dust lanes and the overall structure of the galaxy (Tsvetanov et al. 1997). Right: HST image of IC 5063 of the central regions of IC 5063, taken from the public HST archive. This image is a single 500 s exposure obtained with WFPC2 through the F606W filter, and it shows the structure of the inner dust lanes in the central region. Overplotted are the contours of the 8 GHz continuum emission of the central kpc-sized radio source showing the central core and the eastern and western radio lobes (data from Morganti et al. 1998). Contour levels are 2, 4, 8, 16, 32, 64, and 128 mJy beam-1.
Current usage metrics show cumulative count of Article Views (full-text article views including HTML views, PDF and ePub downloads, according to the available data) and Abstracts Views on Vision4Press platform.
Data correspond to usage on the plateform after 2015. The current usage metrics is available 48-96 hours after online publication and is updated daily on week days.
Initial download of the metrics may take a while.