Fig. 2
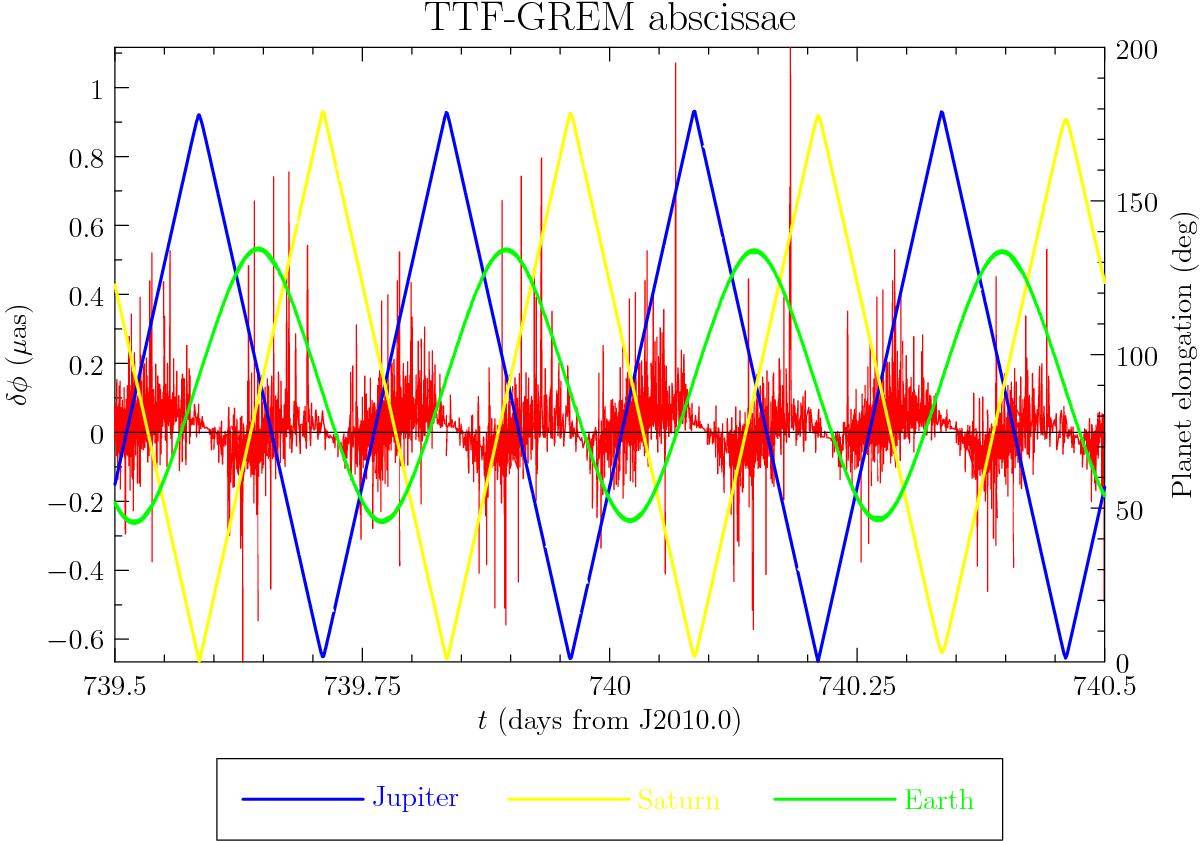
Difference between the abscissae resulting from the GSR-TTF implementation and from GREM implementation in the “GaiaTools”. The left axis indicates the difference in μas between the two models – represented by the red plot; the right axis indicates the distance in degrees between a given planet and the observation – the blue, yellow and green plot representing Jupiter, Saturn and the Earth, respectively.
Current usage metrics show cumulative count of Article Views (full-text article views including HTML views, PDF and ePub downloads, according to the available data) and Abstracts Views on Vision4Press platform.
Data correspond to usage on the plateform after 2015. The current usage metrics is available 48-96 hours after online publication and is updated daily on week days.
Initial download of the metrics may take a while.