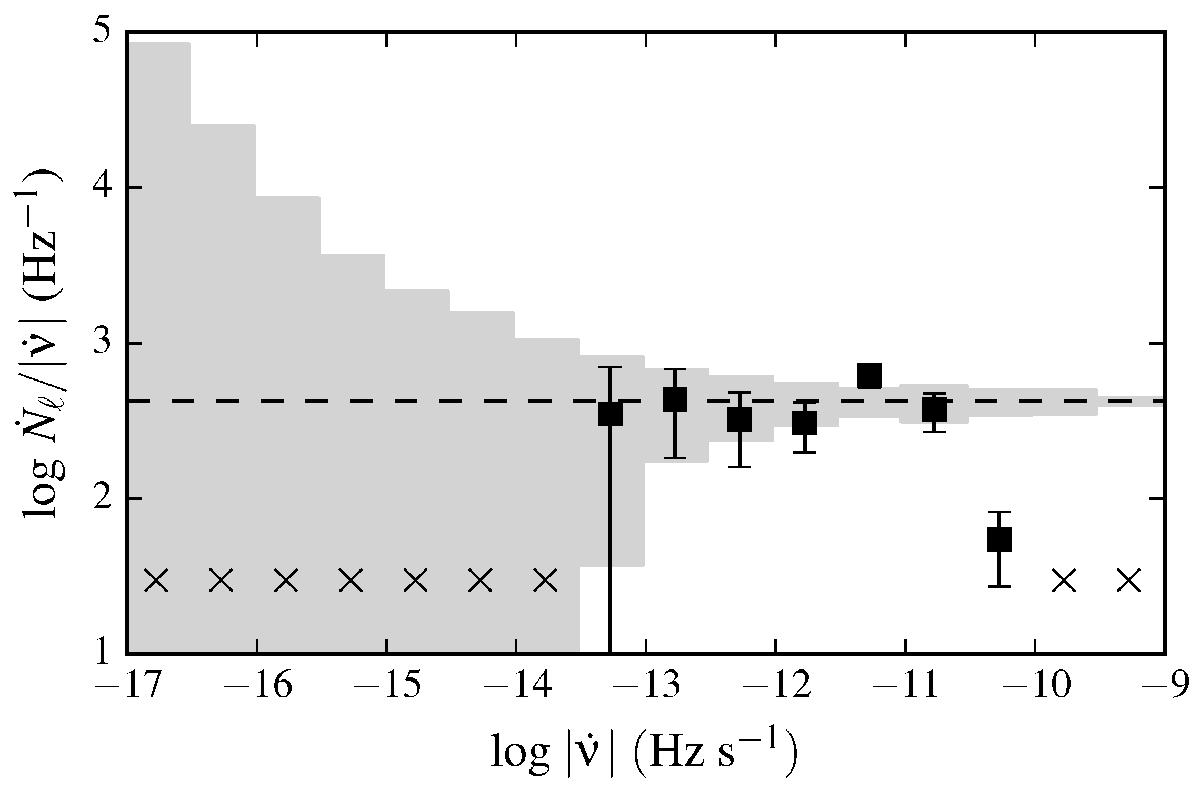
Fig. 6
![]() versus
versus ![]() , where Ṅℓ is the number of large glitches per unit time. The horizontal line corresponds to the logarithm of the mean value
, where Ṅℓ is the number of large glitches per unit time. The horizontal line corresponds to the logarithm of the mean value ![]() , calculated over the bins with
, calculated over the bins with ![]() . The shaded region indicates the expected dispersion around this average value, based on a Poisson distribution of the number of large glitches and the available observing time spans. The black squares represent the observed values of the ratio
. The shaded region indicates the expected dispersion around this average value, based on a Poisson distribution of the number of large glitches and the available observing time spans. The black squares represent the observed values of the ratio ![]() for bins (groups) of pulsars. The crosses denote bins with no large glitches detected.
for bins (groups) of pulsars. The crosses denote bins with no large glitches detected.
Current usage metrics show cumulative count of Article Views (full-text article views including HTML views, PDF and ePub downloads, according to the available data) and Abstracts Views on Vision4Press platform.
Data correspond to usage on the plateform after 2015. The current usage metrics is available 48-96 hours after online publication and is updated daily on week days.
Initial download of the metrics may take a while.