Fig. 3
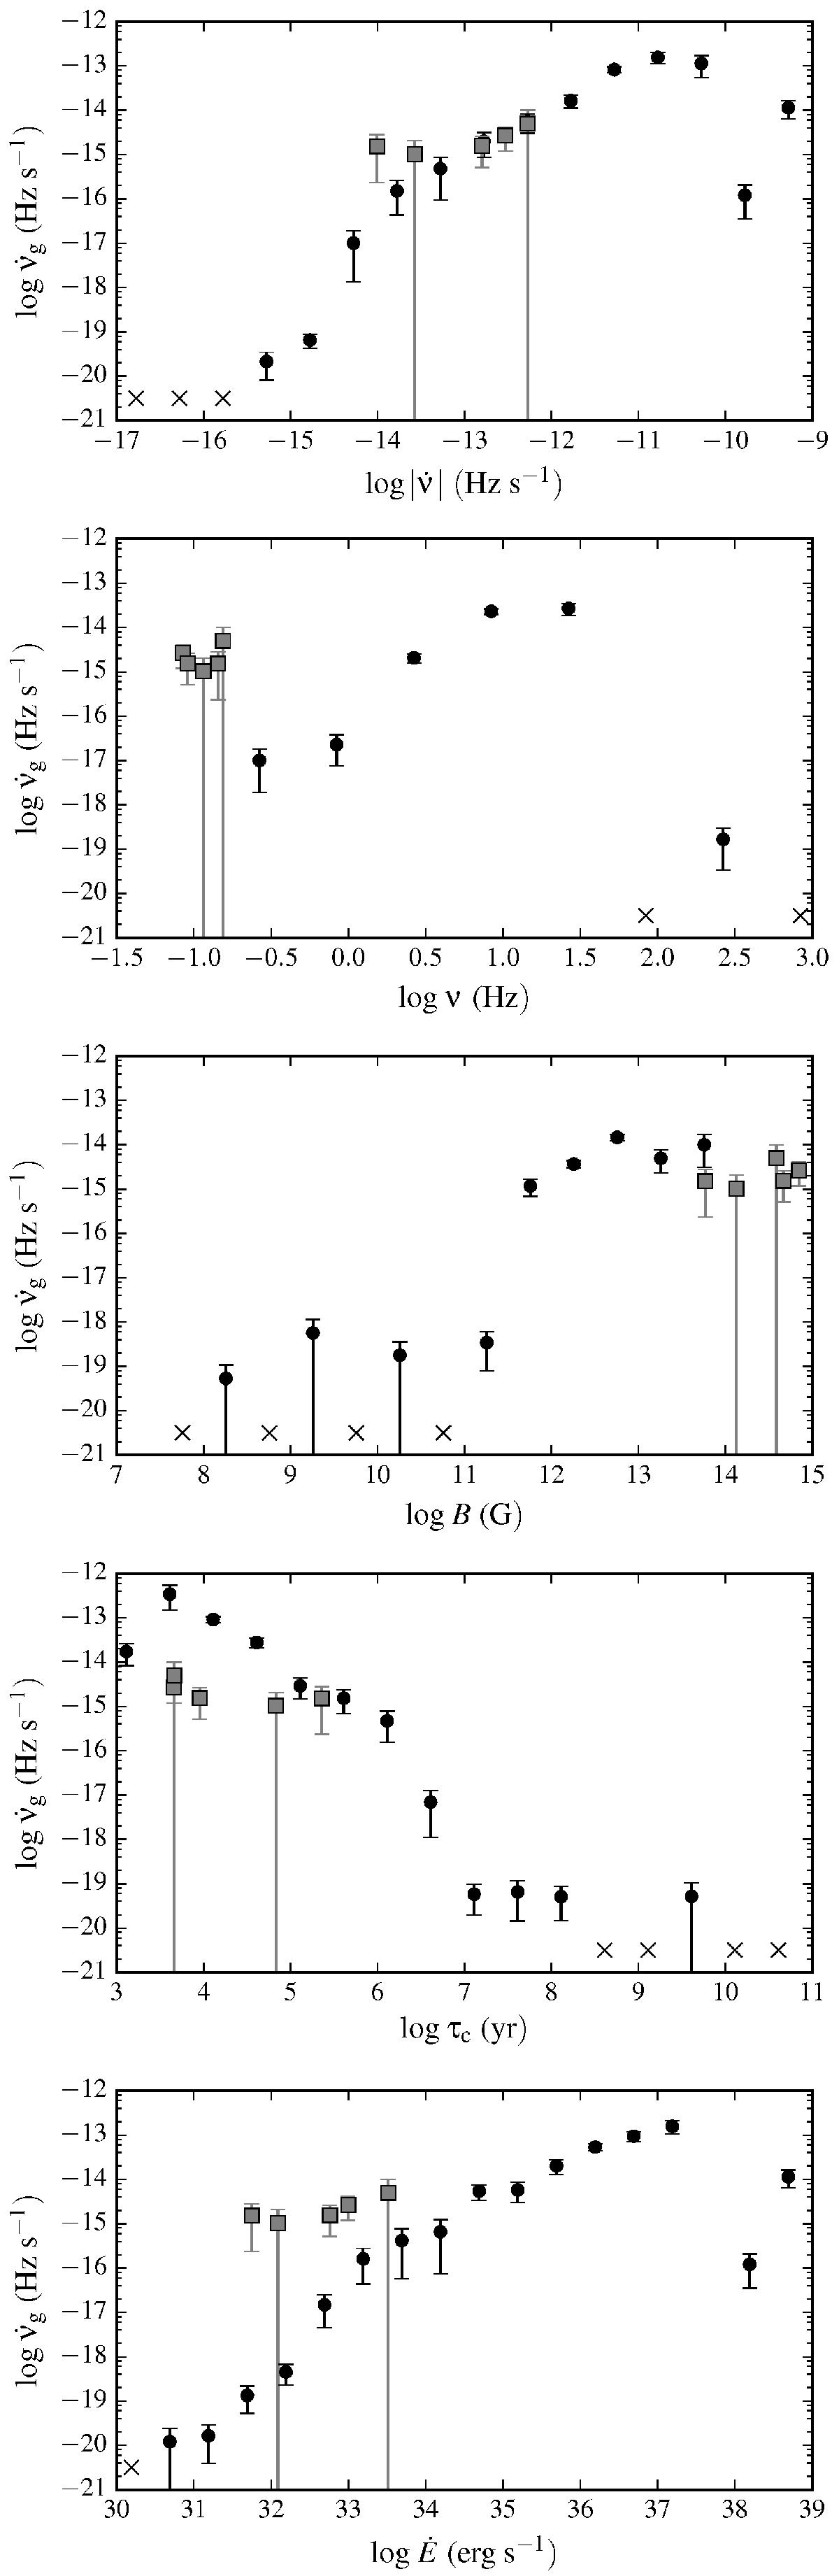
Glitch activity as a function of various pulsar parameters (all of them combinations of frequency ν and its time-derivative ![]() ). Black dots are the
). Black dots are the ![]() values calculated according to Eq. (1), for rotation-powered pulsars grouped in bins of width 0.5 in the logarithm (base 10) of the variable on the horizontal axis. The crosses denote bins (groups of pulsars) with no detected glitches, and the gray squares represent individual magnetars.
values calculated according to Eq. (1), for rotation-powered pulsars grouped in bins of width 0.5 in the logarithm (base 10) of the variable on the horizontal axis. The crosses denote bins (groups of pulsars) with no detected glitches, and the gray squares represent individual magnetars.
Current usage metrics show cumulative count of Article Views (full-text article views including HTML views, PDF and ePub downloads, according to the available data) and Abstracts Views on Vision4Press platform.
Data correspond to usage on the plateform after 2015. The current usage metrics is available 48-96 hours after online publication and is updated daily on week days.
Initial download of the metrics may take a while.