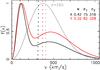
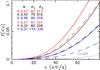
Fig. 9
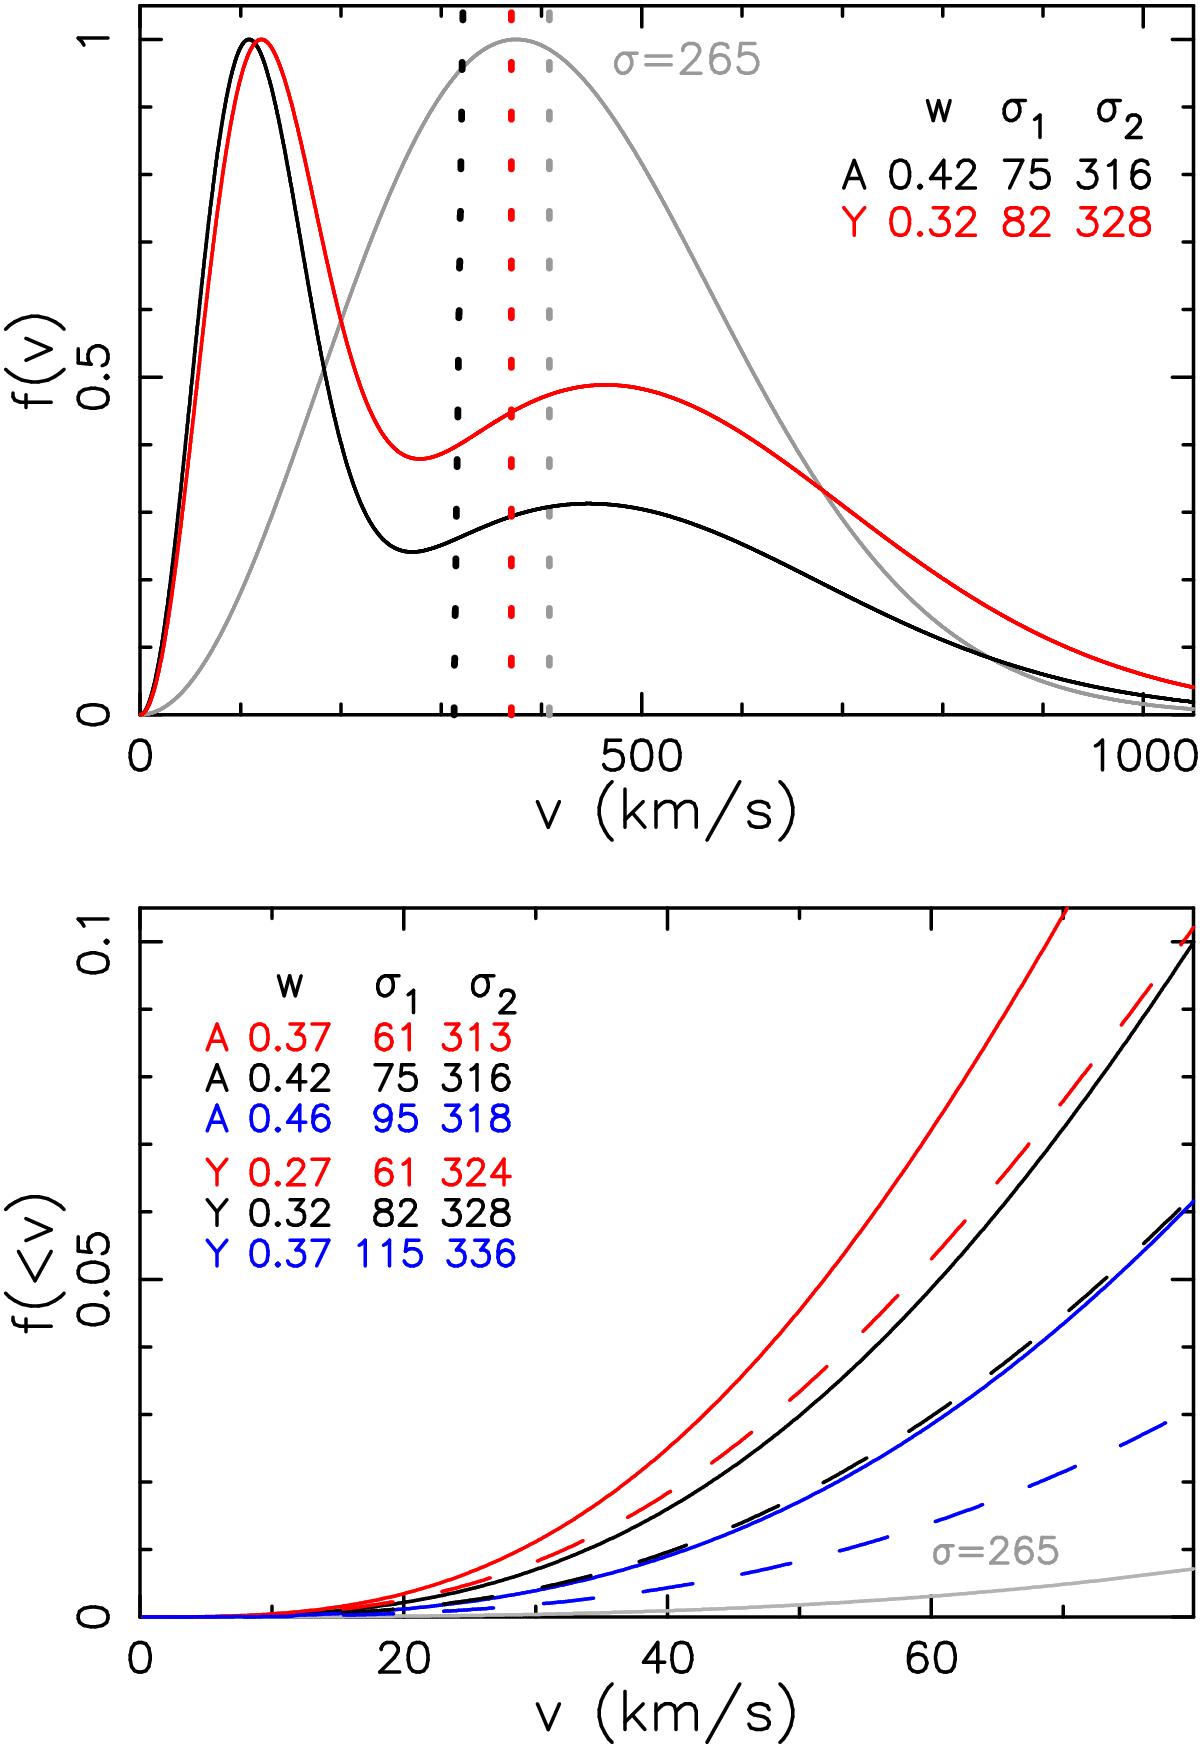
Top: our best velocity distribution for all pulsars and for the youngest pulsars, together with a single Maxwellian. The vertical dotted lines indicates the median velocities: 313, 370 and 408 km s-1. Below: fraction f( <v) of pulsars with velocity less than v, for the best mixed model for all pulsars (black), and for the lowest and highest value in the range of σ1 (red, blue). Solid lines: all pulsars; dashed lines: pulsars with τc < 10 Myr. In grey we show the fraction for a single Maxwellian (Hobbs et al. 2005).
Current usage metrics show cumulative count of Article Views (full-text article views including HTML views, PDF and ePub downloads, according to the available data) and Abstracts Views on Vision4Press platform.
Data correspond to usage on the plateform after 2015. The current usage metrics is available 48-96 hours after online publication and is updated daily on week days.
Initial download of the metrics may take a while.