Fig. 7
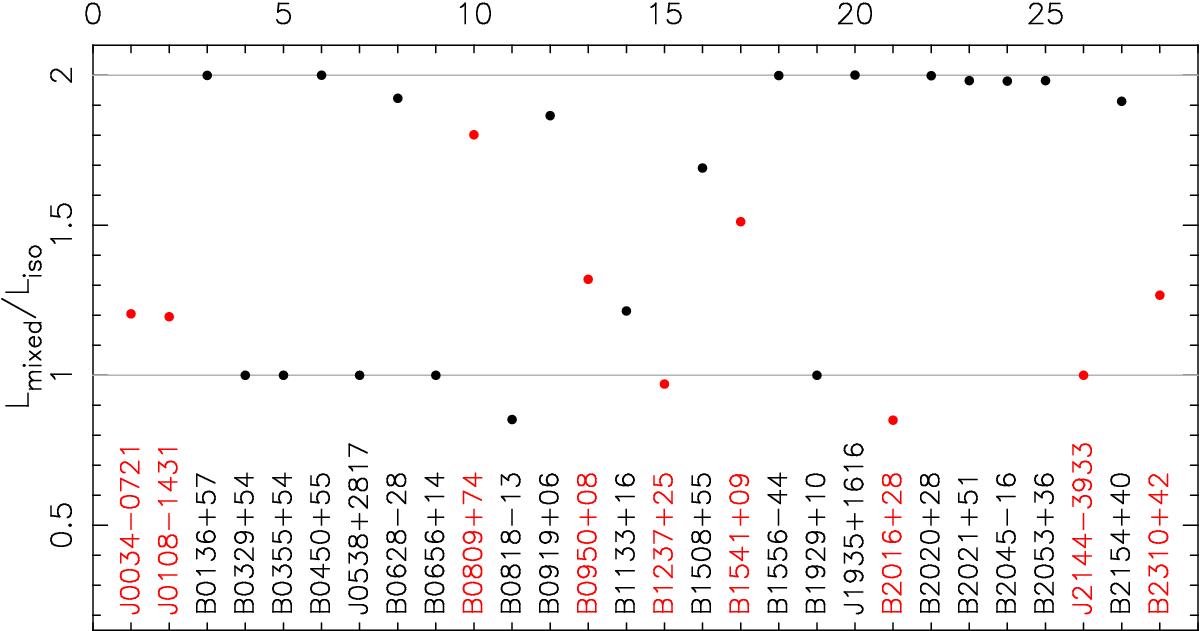
Ratio of the likelihoods in the mixed and isotropic models shown for each pulsar . The red colour indicates old pulsars, with τc > 10 Myr. To illustrate the pure effect of the normalization of the velocity distribution, we use the same parameters σ = (76 km s-1, 318 km s-1, 0.32) for both likelihoods. Use of σopt for each model separately gives rise to small shifts.
Current usage metrics show cumulative count of Article Views (full-text article views including HTML views, PDF and ePub downloads, according to the available data) and Abstracts Views on Vision4Press platform.
Data correspond to usage on the plateform after 2015. The current usage metrics is available 48-96 hours after online publication and is updated daily on week days.
Initial download of the metrics may take a while.