Fig. 1
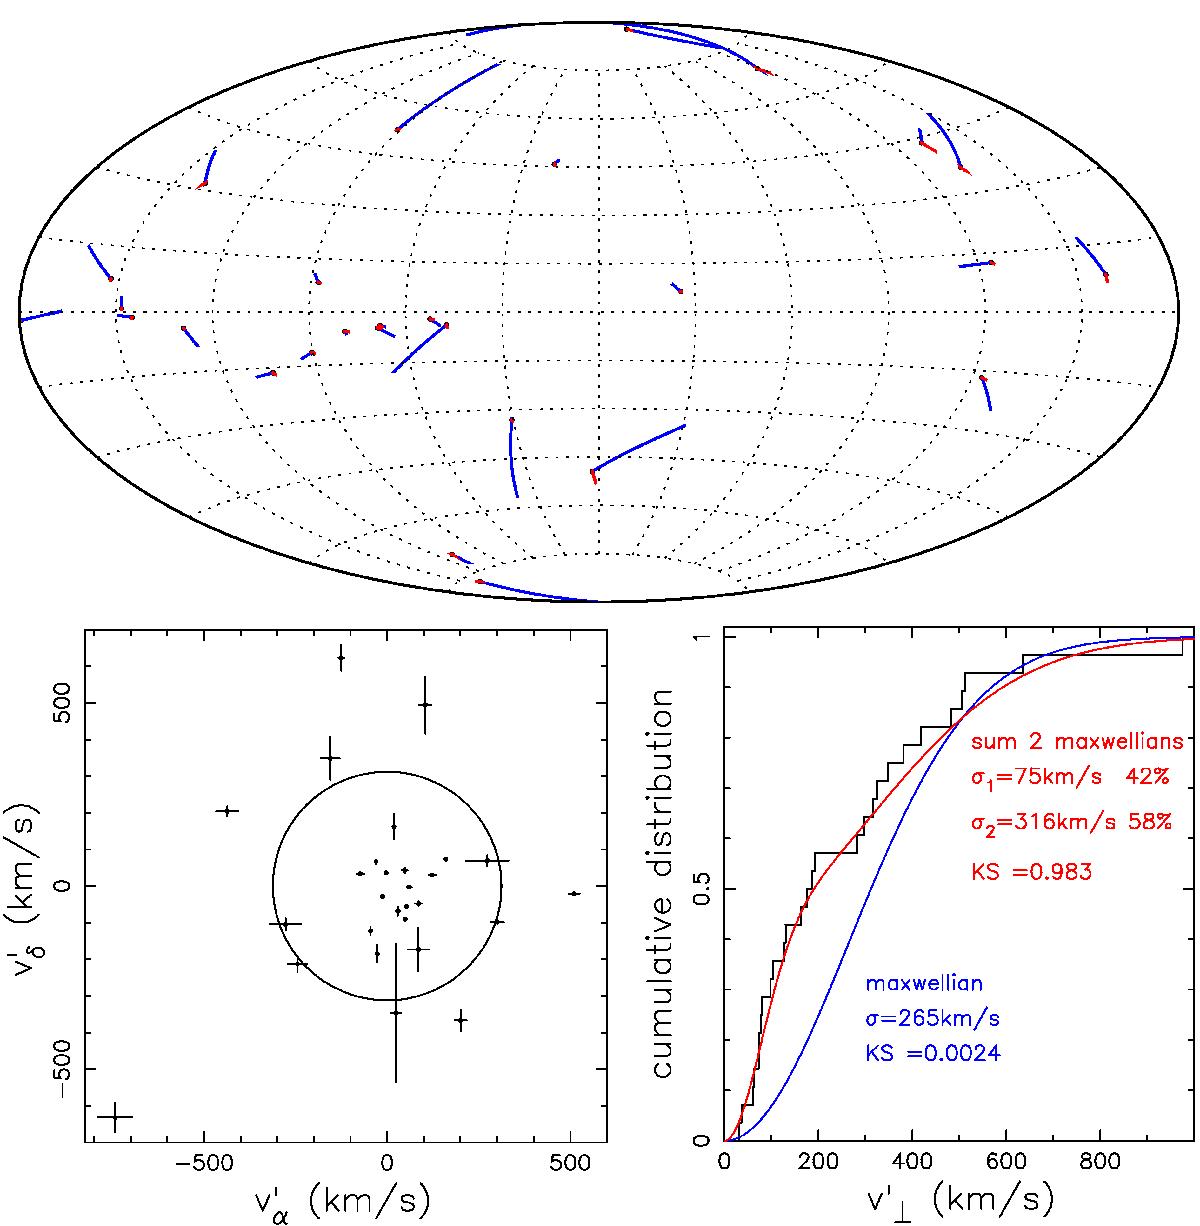
Illustrations of data from our master list of pulsars Table D.1. Top: celestial distribution in Galactic coordinates. The blue lines show the observed proper motion μ′ and the red lines the correction due to Galactic rotation (for nominal distance D′), in 0.5 Myr. Below left: nominal velocities in the celestial plane. The circle indicates the median value for v⊥ for the projection of a Maxwellian: ![]() , for σ = 265 km s-1. Below right: cumulative distributions of the observed
, for σ = 265 km s-1. Below right: cumulative distributions of the observed ![]() , and of v⊥, blue: according to Hobbs et al. (2005), red: according to our best solution, with the p-value according to a one-sided Kolmogorov-Smirnov test that the observed distribution is drawn from the theoretical one.
, and of v⊥, blue: according to Hobbs et al. (2005), red: according to our best solution, with the p-value according to a one-sided Kolmogorov-Smirnov test that the observed distribution is drawn from the theoretical one.
Current usage metrics show cumulative count of Article Views (full-text article views including HTML views, PDF and ePub downloads, according to the available data) and Abstracts Views on Vision4Press platform.
Data correspond to usage on the plateform after 2015. The current usage metrics is available 48-96 hours after online publication and is updated daily on week days.
Initial download of the metrics may take a while.