Fig. 9
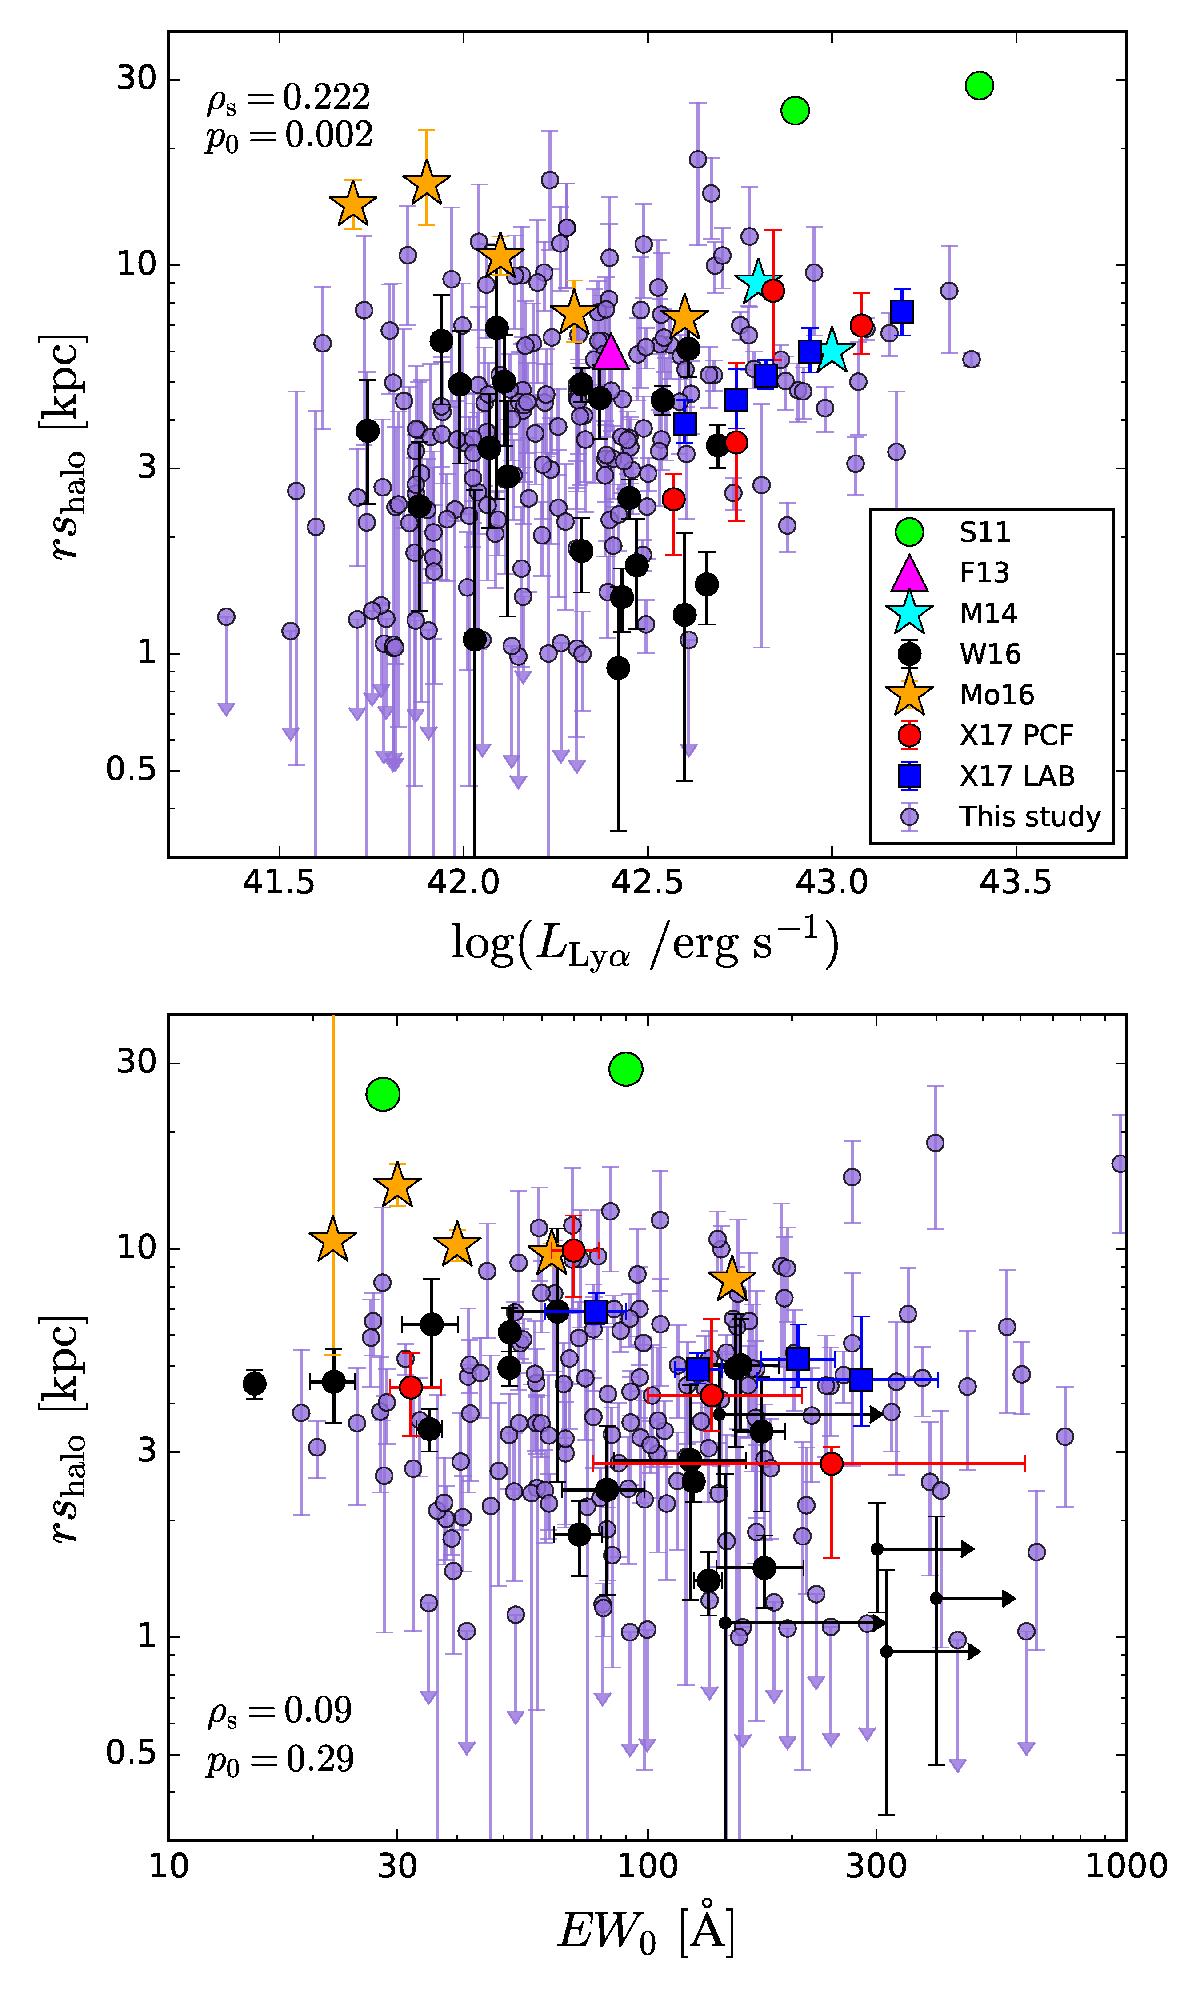
Halo scale length plotted as a function of total Lyα luminosities (upper panel) and total rest-frame Lyα EW (lower panel). Only the 121 LAEs with the EWs from the H17 sample are included for the lower panel. Our results are shown by the purple dots while W16 results correspond to the black dots. Arrows show upper limits. Values from studies using stacking methods are indicated by coloured symbols: X17 (red circles for their stacked images of LAEs from a protocluster field (PCF), and blue squares around a Lyα blob (LAB)), Momose et al. (2016, orange), Momose et al. (2014, blue), Feldmeier et al. (2013, magenta), and Steidel et al. (2011, green). Spearman rank correlation coefficients ρs and corresponding p0 values for our results and those of W16 (without upper and lower limits) are shown in each panel.
Current usage metrics show cumulative count of Article Views (full-text article views including HTML views, PDF and ePub downloads, according to the available data) and Abstracts Views on Vision4Press platform.
Data correspond to usage on the plateform after 2015. The current usage metrics is available 48-96 hours after online publication and is updated daily on week days.
Initial download of the metrics may take a while.