Fig. 8
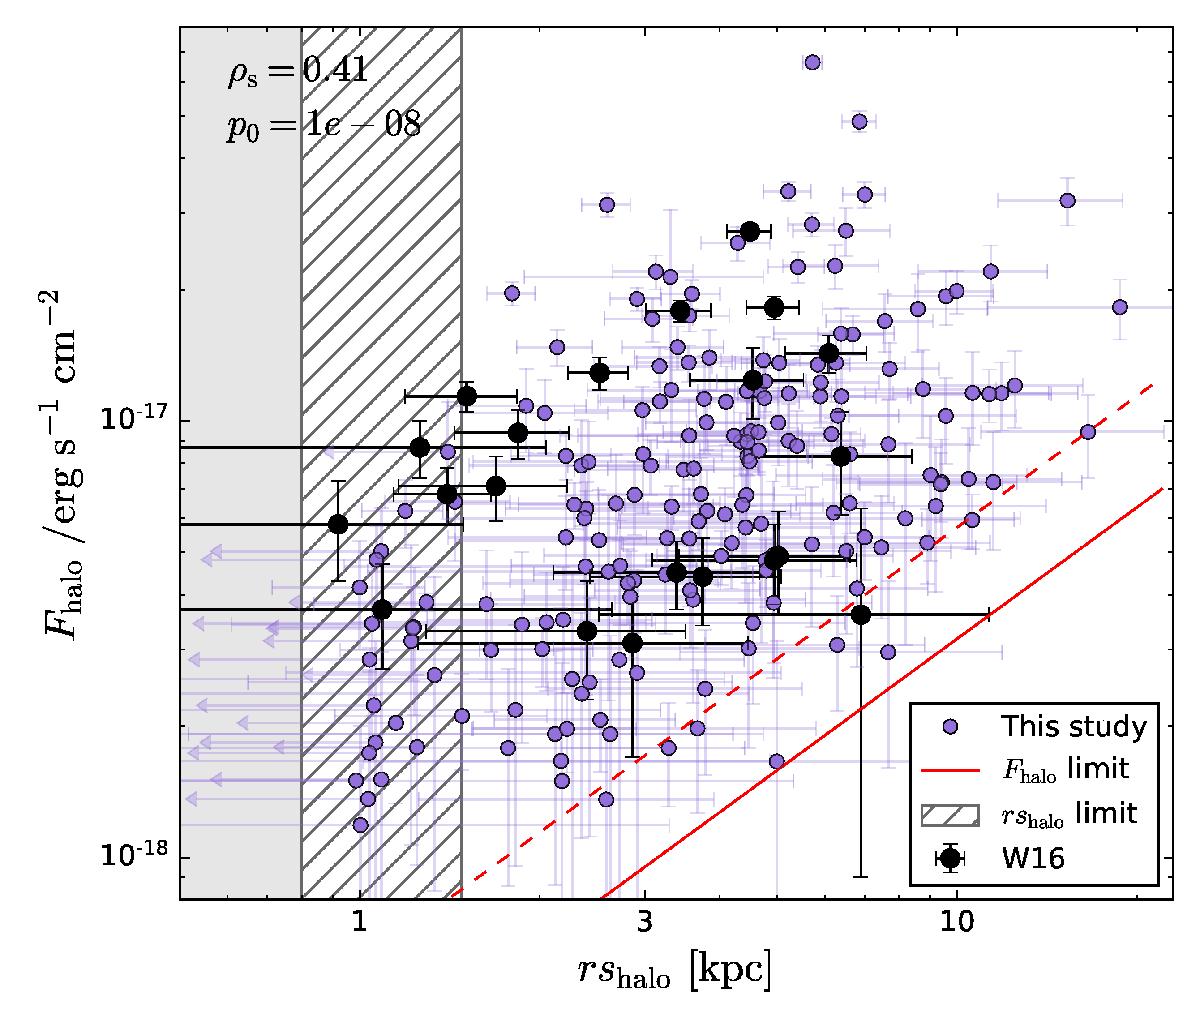
Lyα halo flux as a function of halo scale length. Our limiting Lyα halo flux and scale length are indicated by the red lines (dashed for the mosaic and solid for udf-10 sample) and grey hashed area, respectively (see Sect. 4.3.2). Upper limits on the scale lengths are indicated by arrows. W16 measurements are indicated by the black points. Spearman rank correlation coefficients ρs and corresponding p0 values for our results and those of W16 (excluding upper limits) are shown in each panel.
Current usage metrics show cumulative count of Article Views (full-text article views including HTML views, PDF and ePub downloads, according to the available data) and Abstracts Views on Vision4Press platform.
Data correspond to usage on the plateform after 2015. The current usage metrics is available 48-96 hours after online publication and is updated daily on week days.
Initial download of the metrics may take a while.