Fig. 7
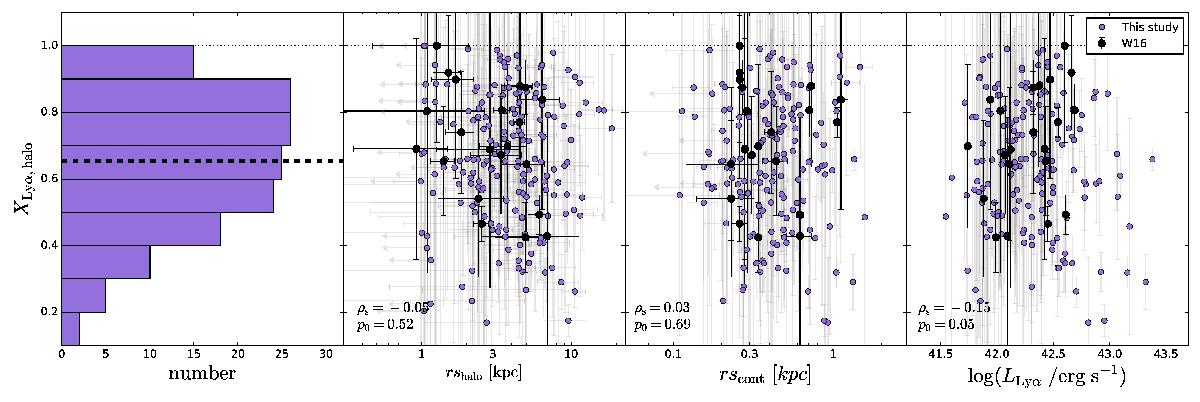
Lyα halo flux fraction XLyα,halo as a function of Lyα halo and UV continuum scale lengths (second and third panel, respectively) and against total Lyα luminosity (right panel). The first panel shows the XLyα,halo distribution (objects without HST detection and with upper limit on their Lyα halo scale length are not included). The median value (0.65) is indicated by the black dashed line. Upper limits on the scale lengths are indicated by arrows. W16 measurements are indicated by the black points. Spearman rank correlation coefficients ρs and corresponding p0 values for our results (excluding upper limits) and those of W16 are shown in each panel.
Current usage metrics show cumulative count of Article Views (full-text article views including HTML views, PDF and ePub downloads, according to the available data) and Abstracts Views on Vision4Press platform.
Data correspond to usage on the plateform after 2015. The current usage metrics is available 48-96 hours after online publication and is updated daily on week days.
Initial download of the metrics may take a while.