Fig. 4
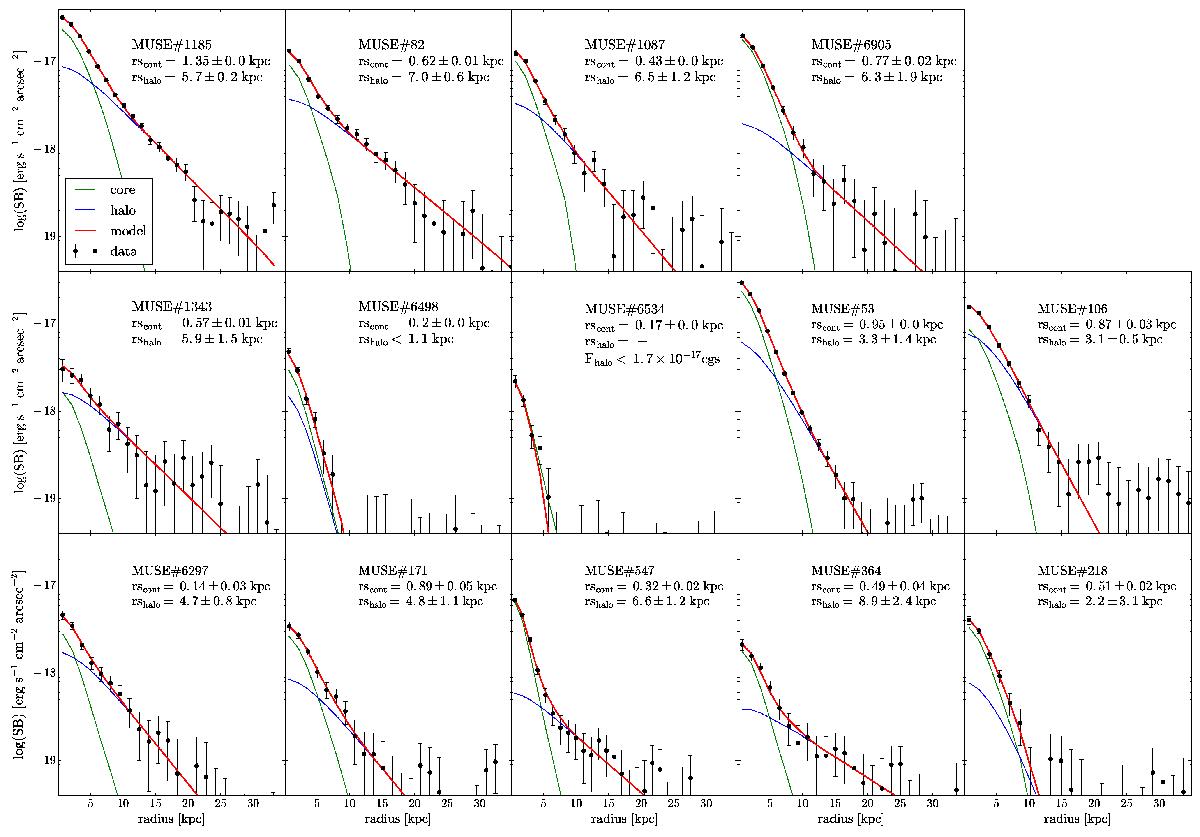
Radial SB profiles of the modelled Lyα distribution decomposed into central (green lines) and extended (blue lines) exponential components. These are the same objects as in Figs. 2 and 3. The total radial SB profiles of the modelled Lyα emission are shown in red. For comparison, the observed radial SB profiles are overplotted as black points. The fit is performed on the 2D Lyα NB image and not on the 1D radial SB profiles shown. The best-fit scale lengths are indicated in physical kpc. Upper limits and detection limits are also indicated (see Sect. 4.3.2).
Current usage metrics show cumulative count of Article Views (full-text article views including HTML views, PDF and ePub downloads, according to the available data) and Abstracts Views on Vision4Press platform.
Data correspond to usage on the plateform after 2015. The current usage metrics is available 48-96 hours after online publication and is updated daily on week days.
Initial download of the metrics may take a while.