Fig. 2
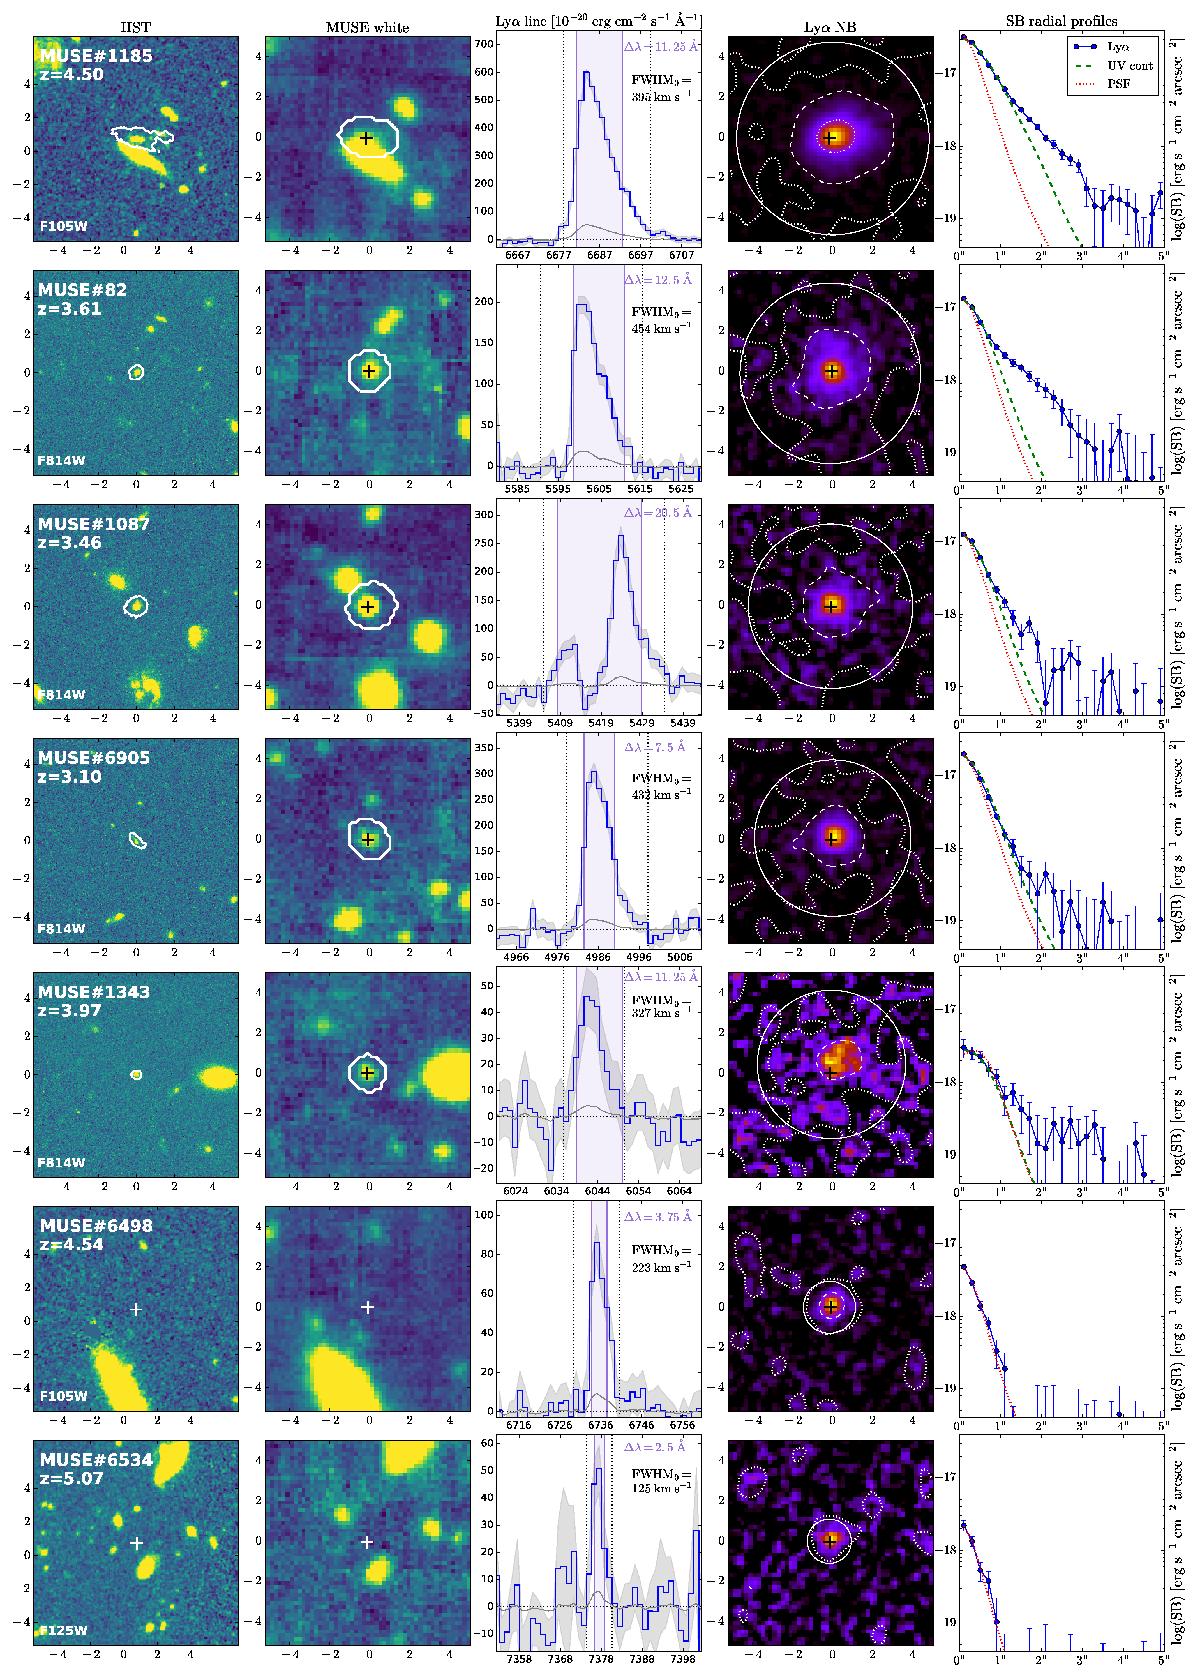
Representative sample of 7 LAEs from the MUSE UDF mosaic field. Each row shows a different object. First column: HST image (see Sect. 3.1.2) of the LAE indicated by the contour of its HST segmentation mask or by a white cross if it is not detected in the HST images (axis in arcsec). The MUSE ID, z and the HST band are indicated. Second column: MUSE white-light image summed over the full MUSE spectral range (axis in arcsec). The white contours correspond to the HST segmentation mask convolved with the MUSE PSF. The HST coordinates (Rafelski et al. 2015) are indicated by the cross. Third column: Lyα line extracted in the HST segmentation mask convolved with the MUSE PSF. The purple area shows the NB image spectral width (indicated in purple). The two vertical black dotted lines indicate the bandwidth (in Å) used to integrate the total Lyα flux (see Sect. 5.3.2). The rest-frame FWHM of the single-peaked lines is also indicated. Fourth column: Lyα narrowband image with SB contours at 10-17 ergs-1cm-2arcsec-2 (central dotted white), 10-18 ergs-1cm-2arcsec-2 (dashed white), and 10-19 ergs-1cm-2arcsec-2 (outer dotted white). The radius of the solid white circle corresponds to the measured CoG radius rCoG (see Sect. 5.3.2). Last column: radial SB profiles of Lyα emission (blue), UV continuum (green), and the PSF (red).
Current usage metrics show cumulative count of Article Views (full-text article views including HTML views, PDF and ePub downloads, according to the available data) and Abstracts Views on Vision4Press platform.
Data correspond to usage on the plateform after 2015. The current usage metrics is available 48-96 hours after online publication and is updated daily on week days.
Initial download of the metrics may take a while.