Fig. A.2
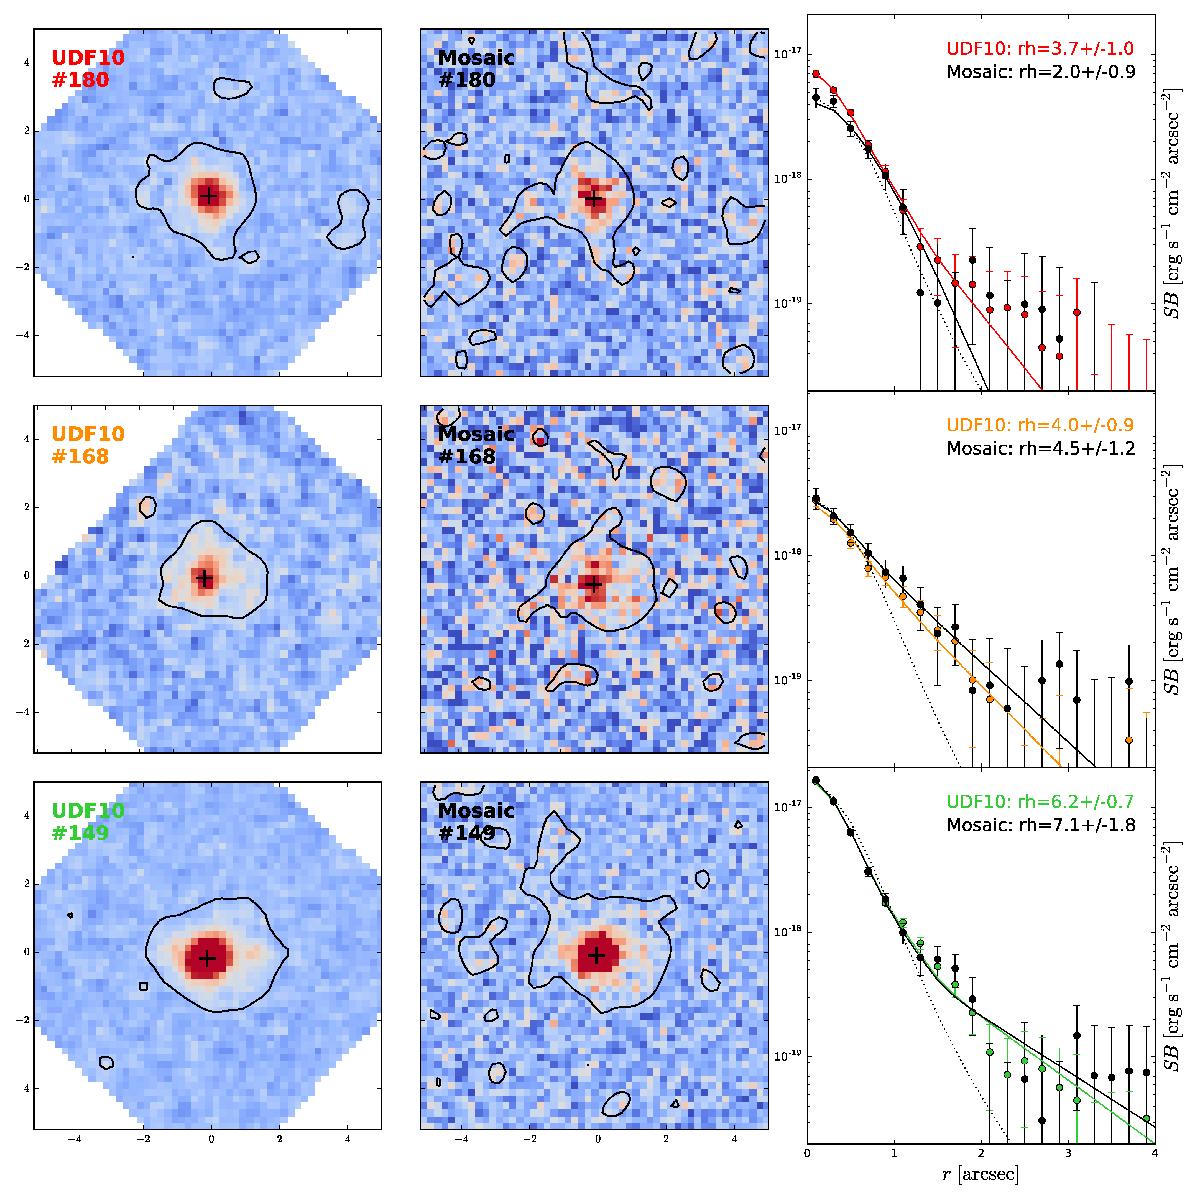
Comparison of the Lyα halo detection for 3 representative objects from the deeper udf-10 data cube and the shallower mosaic data cube. From top to bottom rows show objects #180, #168, and #149, respectively. Left and middle panels: Lyα NB images constructed from the udf-10 and mosaic data cubes, respectively. The black contours show the 10-18.5![]() SB level for the two images. Right panels: comparison of the radial SB profiles measured on the Lyα NB images (data points) and from the modelled Lyα images (lines) in the udf-10 data cube (in colour) and the mosaic data cube (in black). The black dotted line shows the rescaled radial SB of the UV continuum. The best-fit halo scale lengths from the two data cubes are indicated in the upper right corner of each panel.
SB level for the two images. Right panels: comparison of the radial SB profiles measured on the Lyα NB images (data points) and from the modelled Lyα images (lines) in the udf-10 data cube (in colour) and the mosaic data cube (in black). The black dotted line shows the rescaled radial SB of the UV continuum. The best-fit halo scale lengths from the two data cubes are indicated in the upper right corner of each panel.
Current usage metrics show cumulative count of Article Views (full-text article views including HTML views, PDF and ePub downloads, according to the available data) and Abstracts Views on Vision4Press platform.
Data correspond to usage on the plateform after 2015. The current usage metrics is available 48-96 hours after online publication and is updated daily on week days.
Initial download of the metrics may take a while.