Fig. A.1
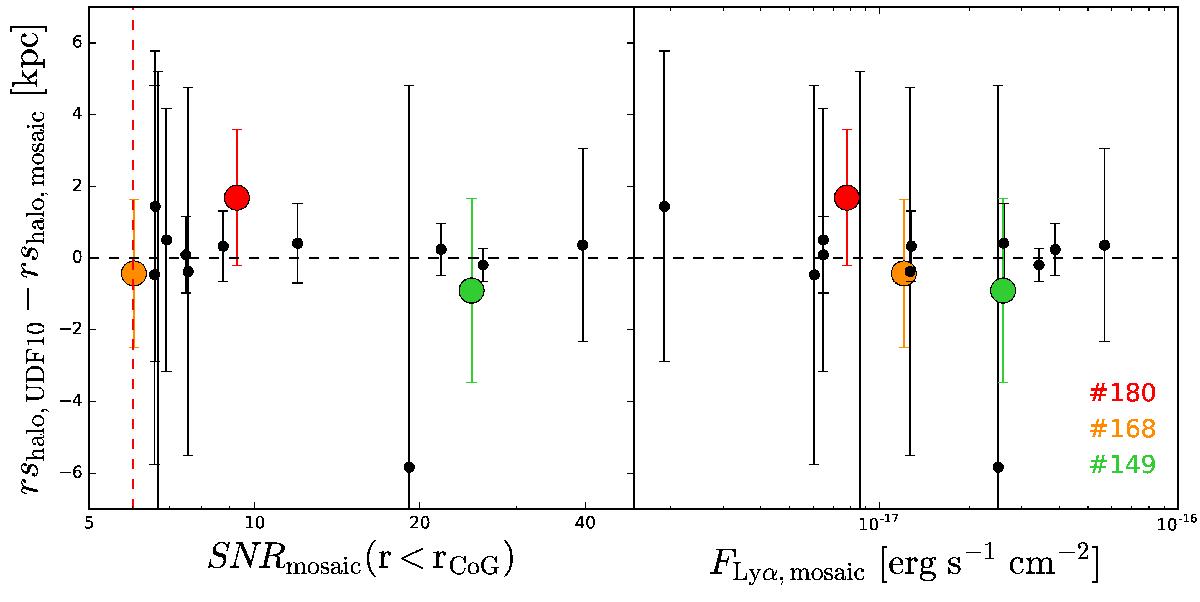
Comparison of the best-fit Lyα halo scale lengths of common objects from the deeper udf-10 data cube (≈30 h) and the shallower mosaic data cube (10 h) with reliable halo measurements (15 objects, see Sect. 4.3.2). Left: difference between the Lyα halo scale lengths, plotted as a function of the Lyα S/N from the mosaic data cube. The S/N is calculated in a fixed aperture corresponding to the CoG radius rCoG (see Sect. 5.3.2). The median difference is ≲0.1 kpc. The dashed red line shows the S/N cut of 6 imposed on our sample (see Sect. 2.2). Right: difference between scale lengths, plotted against the total Lyα flux measured in the mosaic data cube. The red, orange, and green points correspond to the objects shown as examples in Fig. A.2. The corresponding MUSE IDs are indicated.
Current usage metrics show cumulative count of Article Views (full-text article views including HTML views, PDF and ePub downloads, according to the available data) and Abstracts Views on Vision4Press platform.
Data correspond to usage on the plateform after 2015. The current usage metrics is available 48-96 hours after online publication and is updated daily on week days.
Initial download of the metrics may take a while.