Fig. 15
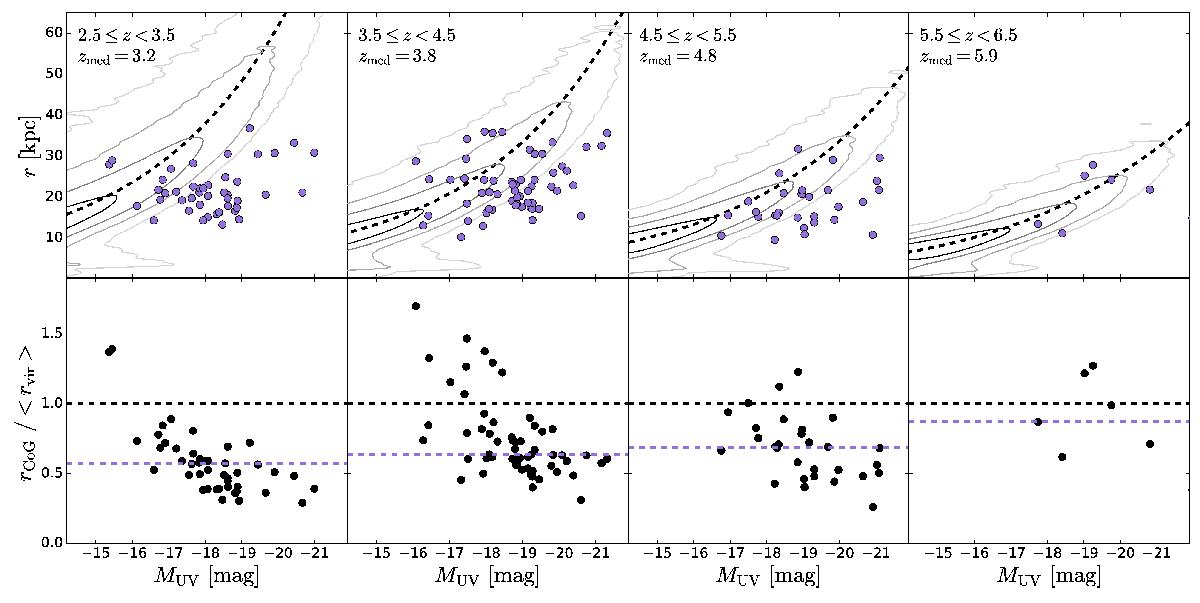
Upper panels: maximum radius of the Lyα haloes detected using the CoG method as a function of the absolute UV magnitude of their host galaxy. The grey contours correspond to the predicted virial radius/UV magnitude relation predicted by a semi-analytic model (Garel et al. 2015, contours at 10-2, 10-3, 10-4, 10-5 percent of the total number of modelled galaxies). The dashed black line corresponds to a polynomial fit of the distribution of the simulated galaxies. Each panel corresponds to a different redshift bin. The plot aims to show what cold CGM scale we probe with Lyman alpha emission. Lower panels: ratio of the predicted median virial radius at a given UV magnitude over the measured CoG radius of individual objects, plotted as a function of absolute UV magnitude in different redshift bins. The median values are indicated by the dashed purple lines.
Current usage metrics show cumulative count of Article Views (full-text article views including HTML views, PDF and ePub downloads, according to the available data) and Abstracts Views on Vision4Press platform.
Data correspond to usage on the plateform after 2015. The current usage metrics is available 48-96 hours after online publication and is updated daily on week days.
Initial download of the metrics may take a while.