Fig. 14
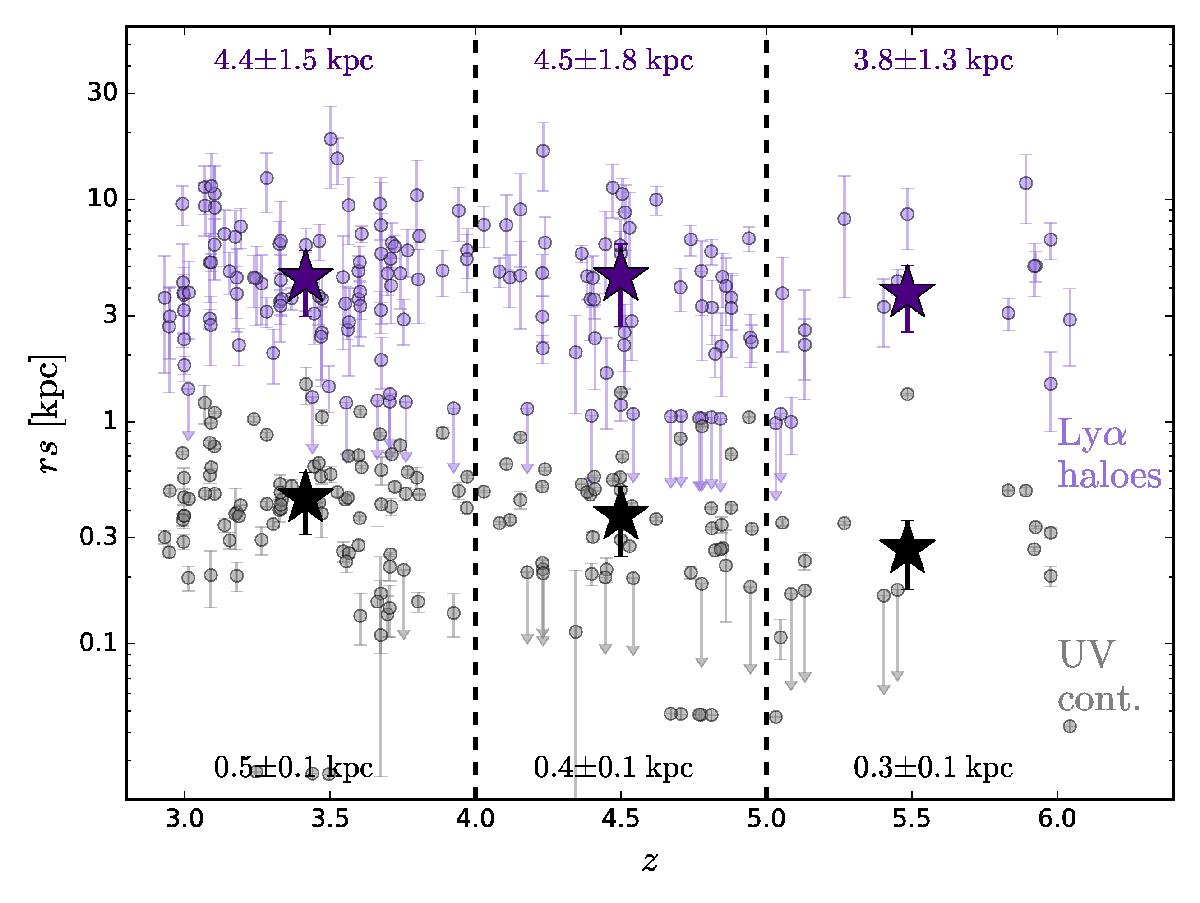
Lyα halo (purple dots) and UV continuum (grey dots) scale lengths as a function of redshift. The median scale lengths in 3 redshift bins (z< 4, 4 ≤ z< 5, z ≥ 5) of both Lyα and UV continuum emission are indicated by the star symbols (error bars correspond to the median absolute deviation). The corresponding numerical values are given at the top and bottom of the figure for the Lyα and UV continuum emission, respectively. The objects with scale length upper limits are not taking into account for the median calculations.
Current usage metrics show cumulative count of Article Views (full-text article views including HTML views, PDF and ePub downloads, according to the available data) and Abstracts Views on Vision4Press platform.
Data correspond to usage on the plateform after 2015. The current usage metrics is available 48-96 hours after online publication and is updated daily on week days.
Initial download of the metrics may take a while.