Fig. 13
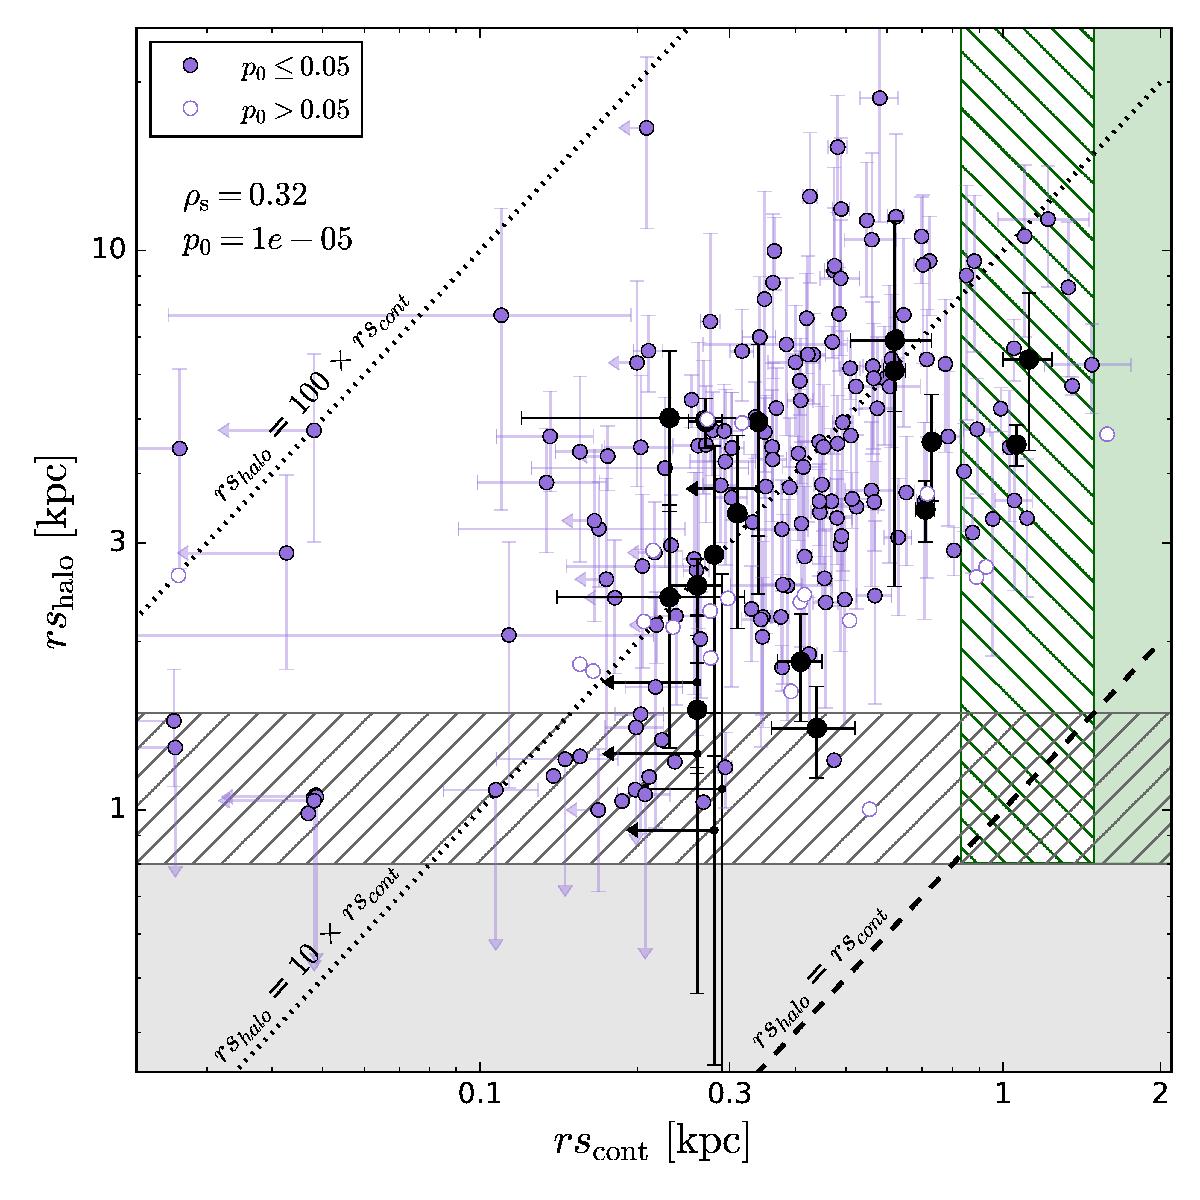
Lyα halo scale length as a function of UV continuum scale length. The grey area corresponds to the Lyα halo range for which we cannot reliably measure the Lyα halo size (see Sect. 4.3.2). This wavelength-dependent size limit spans from 0.85 kpc to 1.48 kpc and is represented by the grey hatched area (see Sect. 4.3.2). The green area shows the objects for which we would be able to detect the absence of a Lyα halo with our data. This limit also depends on the wavelength and is shown by the green dashed area. The black dashed line corresponds to a size ratio of 1 (meaning no halo). The two dotted lines indicate ratios of 10 and 100 as indicated in the figure. Upper limit scale lengths are indicated by arrows and objects without a statistically significant Lyα halo are shown by empty symbols. The W16 results are shown with black points. Spearman rank correlation coefficients ρs and corresponding p0 values for our results and those of W16 (without upper limits) are shown in each panel.
Current usage metrics show cumulative count of Article Views (full-text article views including HTML views, PDF and ePub downloads, according to the available data) and Abstracts Views on Vision4Press platform.
Data correspond to usage on the plateform after 2015. The current usage metrics is available 48-96 hours after online publication and is updated daily on week days.
Initial download of the metrics may take a while.