Fig. 12
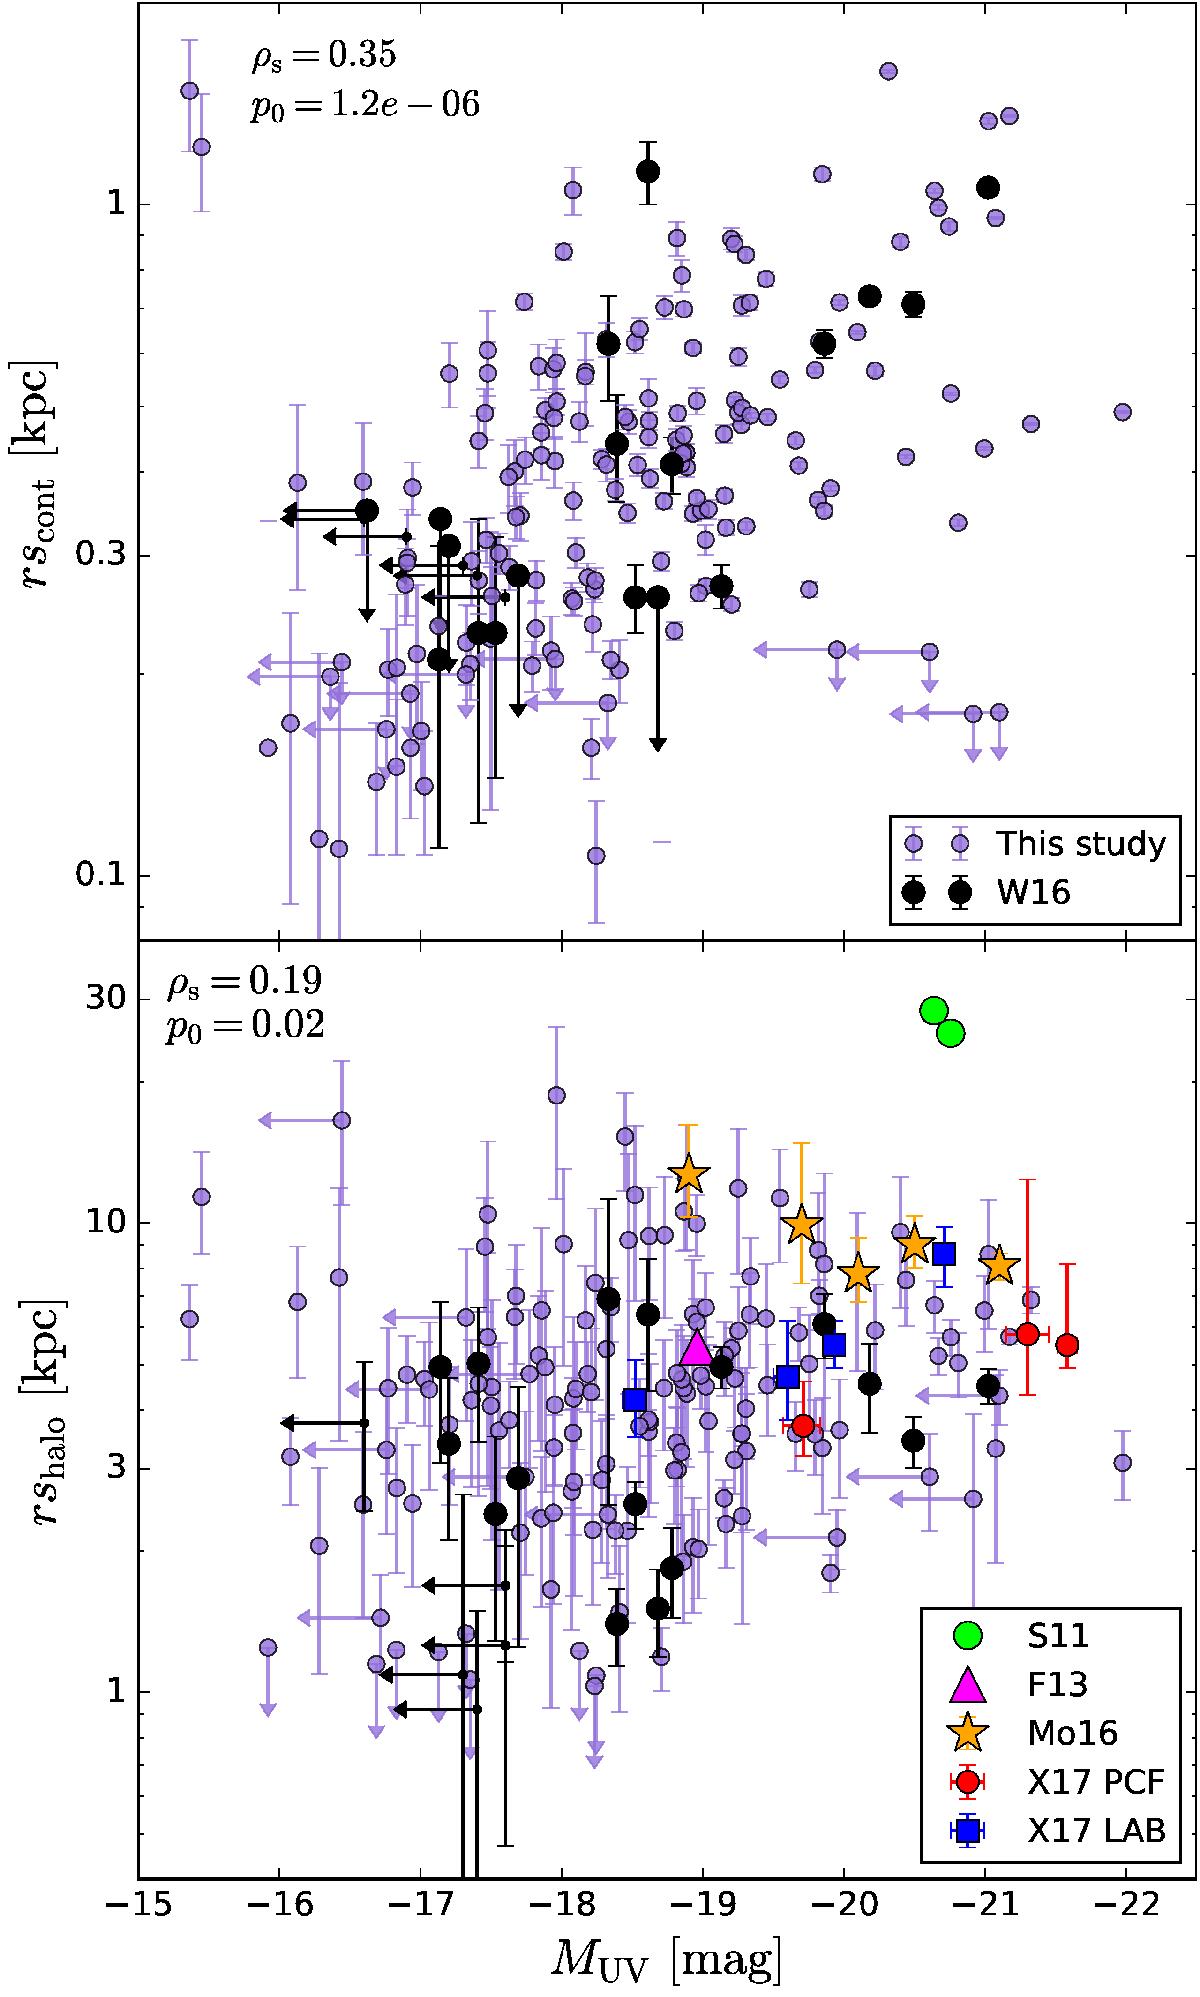
UV continuum scale length (upper) and Lyα halo scale length (lower) as a function of absolute far-UV magnitude. Only the objects with a statistically significant Lyα halo are shown (see Sect. 5.1). Upper limits on the scale lengths and UV magnitudes are indicated by arrows. The W16 measurements are shown in black, Steidel et al. (2011) by green dots, Feldmeier et al. (2013) by magenta triangles, Momose et al. (2016) by orange stars, and X17 by red points (LAEs from a protocluster field “PCF”) and blue squares (LAEs around a Lyα blob “LAB”). Spearman rank correlation coefficients ρs and corresponding p0 values for our results and those of W16 (without upper limits) are shown in each panel.
Current usage metrics show cumulative count of Article Views (full-text article views including HTML views, PDF and ePub downloads, according to the available data) and Abstracts Views on Vision4Press platform.
Data correspond to usage on the plateform after 2015. The current usage metrics is available 48-96 hours after online publication and is updated daily on week days.
Initial download of the metrics may take a while.