Free Access
Fig. 1
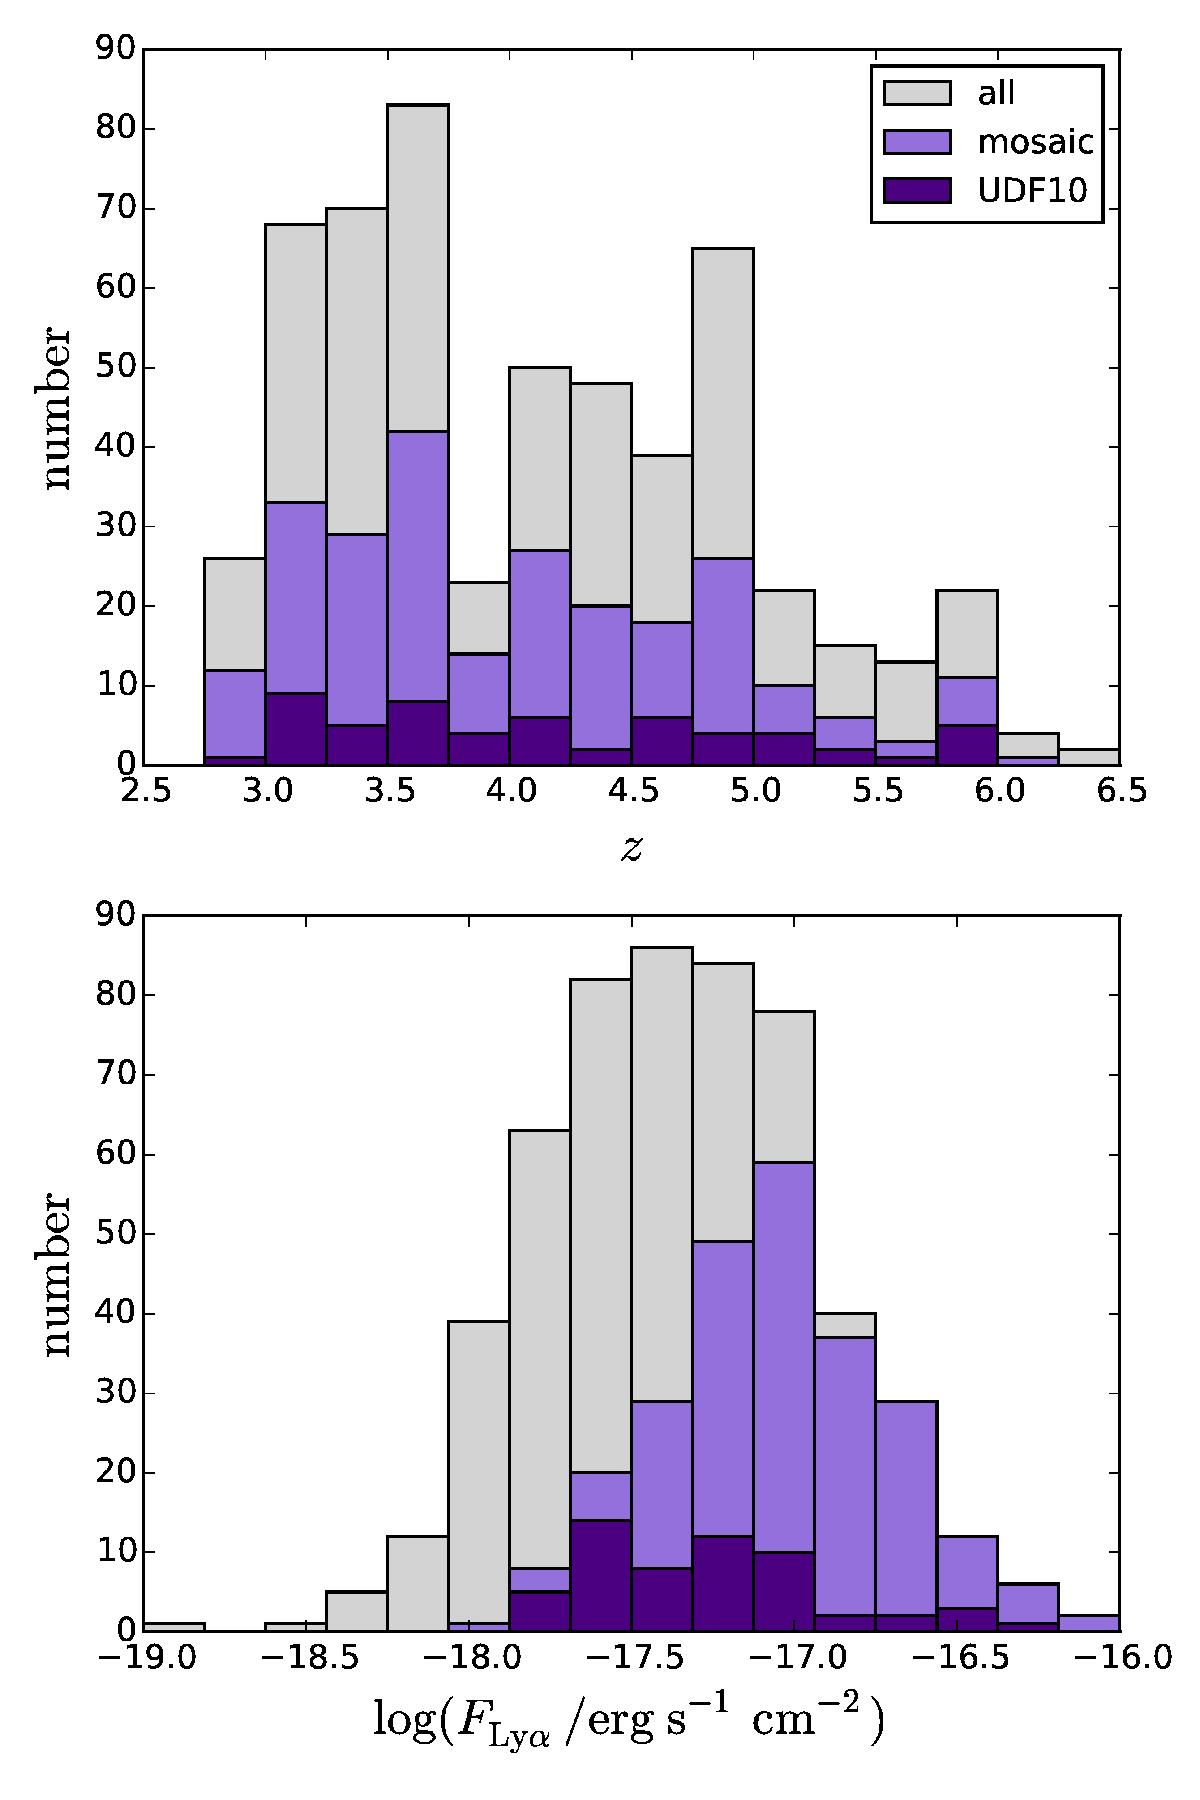
Redshift distribution (upper panel) and total Lyα flux (measured using a CoG method, see Sect. 5.3.2 – lower panel) histograms of our udf-10 (dark purple) and mosaic (light purple) samples. The grey histograms show the distributions of the total sample (udf-10 and mosaic) without applying the S/N cut.
Current usage metrics show cumulative count of Article Views (full-text article views including HTML views, PDF and ePub downloads, according to the available data) and Abstracts Views on Vision4Press platform.
Data correspond to usage on the plateform after 2015. The current usage metrics is available 48-96 hours after online publication and is updated daily on week days.
Initial download of the metrics may take a while.