Fig. 4
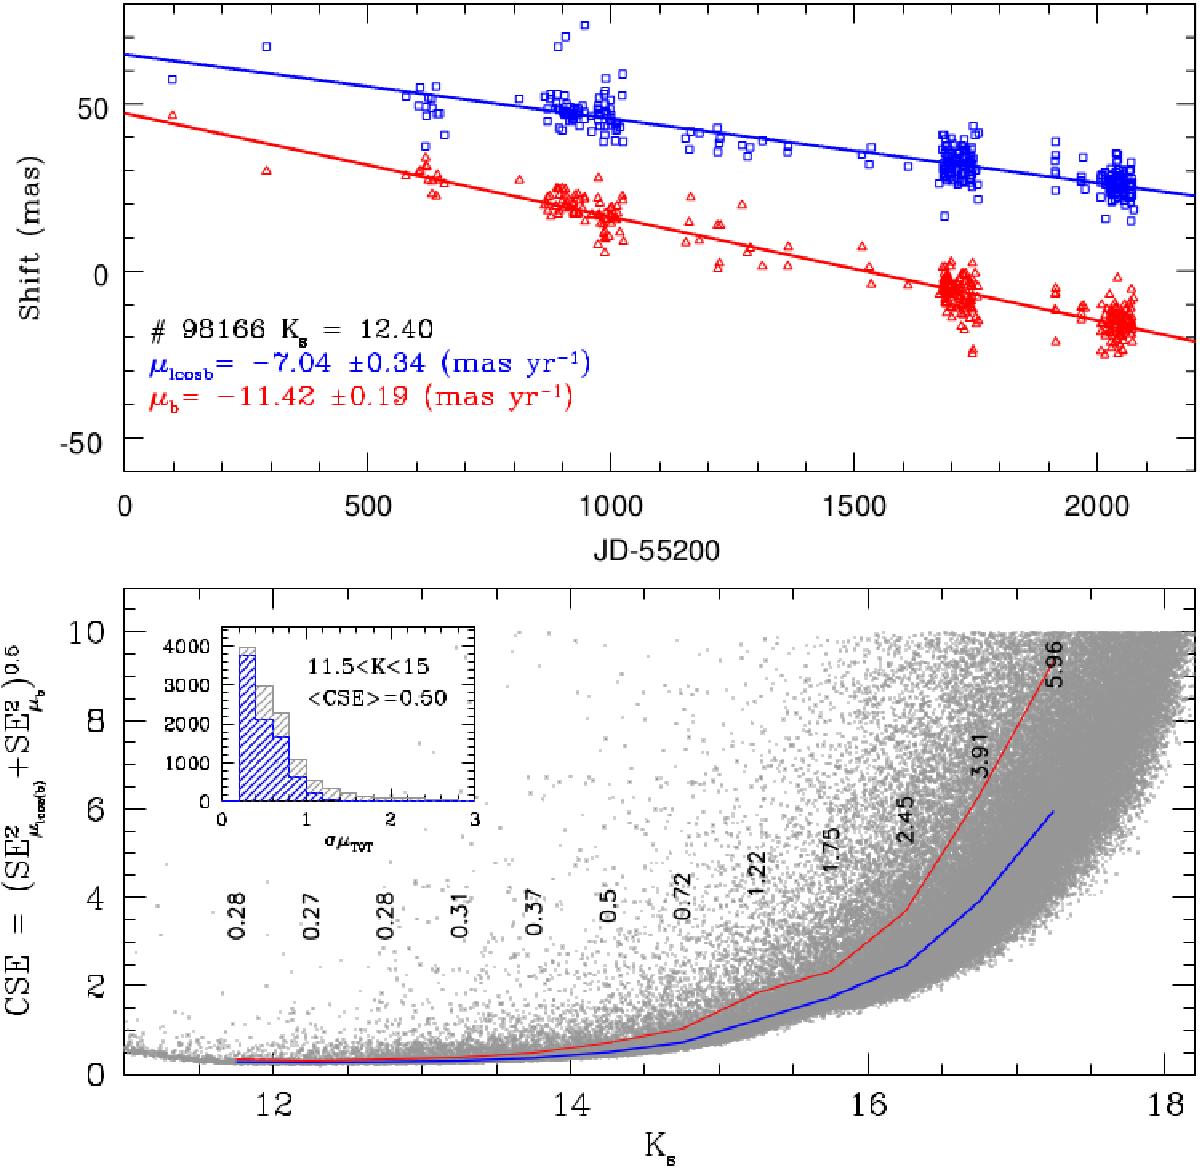
Top: example of PM determination by means of the least square fitting for one of the cluster stars (#98166), with magnitude Ks = 12.4 mag. Each point is the star position in different epochs after been locally-transformed to the reference system of the master catalog. Bottom: CSE in the PM, computed as the error on the slope in the linear fit shown above, as a function of Ks magnitude. The thin red line marks a 3σ clipping on the error distribution; the thick blue line is the median error. Numbers list mean errors in bins of 0.5 mag. The figure inset shows the histogram of errors for 11.5 <Ks< 15 mag before (gray) and after (blue) the 3σ clipping.
Current usage metrics show cumulative count of Article Views (full-text article views including HTML views, PDF and ePub downloads, according to the available data) and Abstracts Views on Vision4Press platform.
Data correspond to usage on the plateform after 2015. The current usage metrics is available 48-96 hours after online publication and is updated daily on week days.
Initial download of the metrics may take a while.