Free Access
Fig. 3
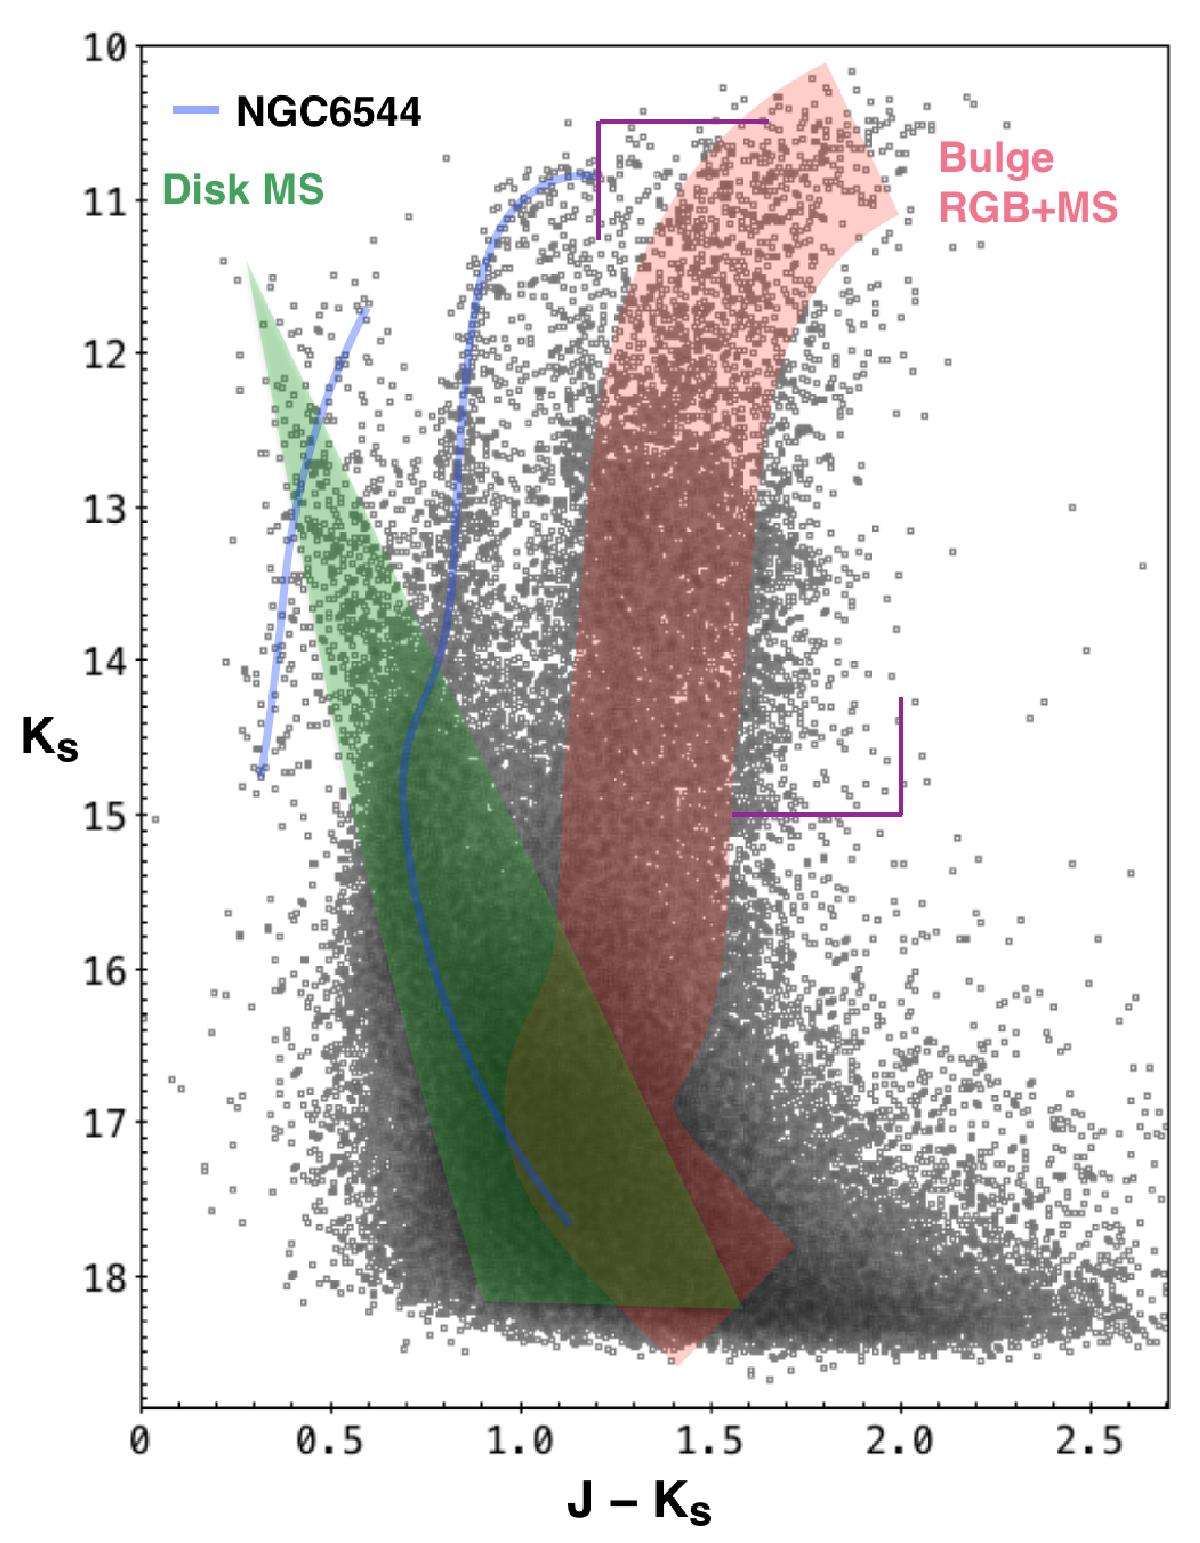
CMD for all the stars detected in the field shown in Fig. 1. The hand drawn blue line shows the approximate location of the cluster sequences, while the red and green areas show the bulge RGB and disk MS, respectively.
Current usage metrics show cumulative count of Article Views (full-text article views including HTML views, PDF and ePub downloads, according to the available data) and Abstracts Views on Vision4Press platform.
Data correspond to usage on the plateform after 2015. The current usage metrics is available 48-96 hours after online publication and is updated daily on week days.
Initial download of the metrics may take a while.