Fig. 12
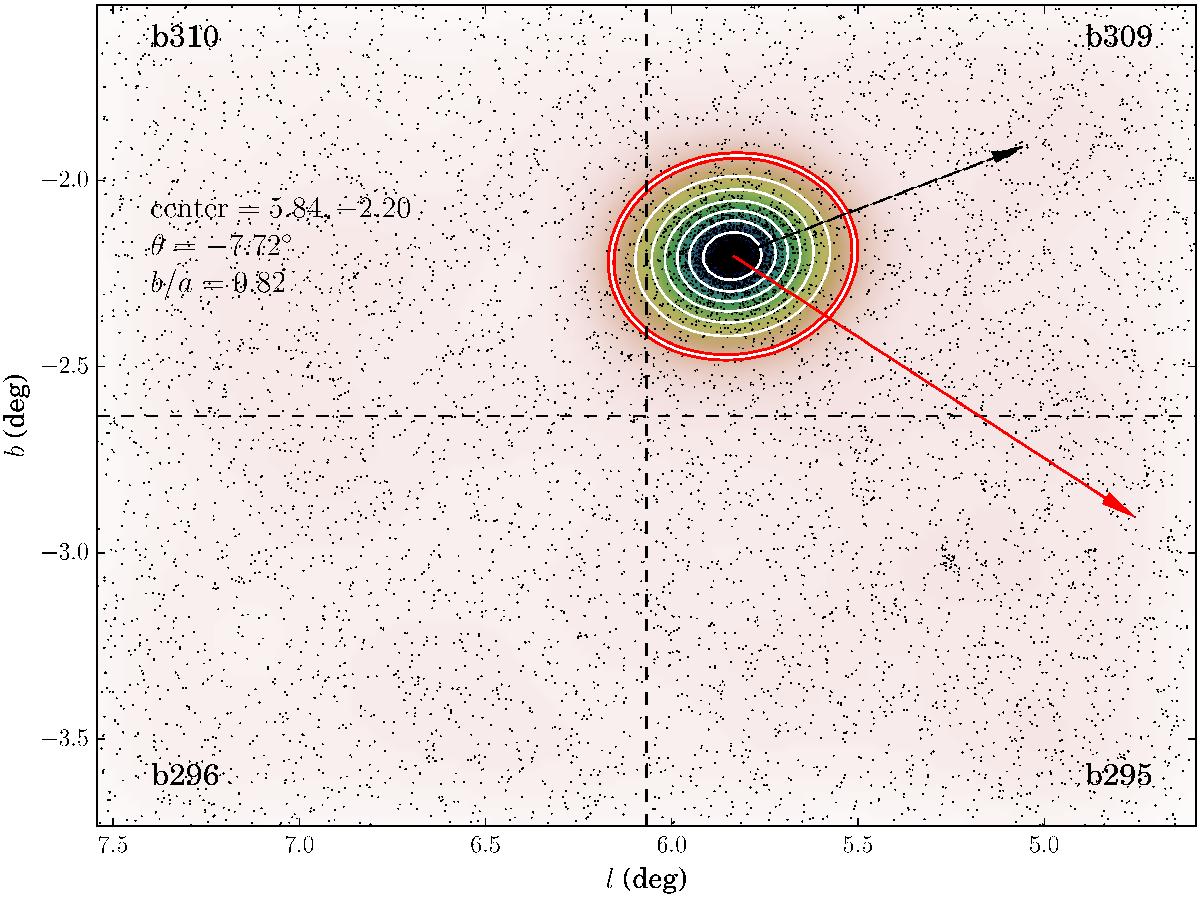
Galactic coordinate map of the area covered by the tiles b295, b296, b309 and b310. Black points depict the position of likely cluster stars with low PM errors. A color map highlights their surface count density, and a set of contour lines is drawn around the center of NGC 6544. The black and red arrows points toward the Galactic center and along the direction of the cluster orbit, respectively. The cluster center, eccentricity of the outermost contour line, and the angle between its major axis and the Galactic equator are quoted.
Current usage metrics show cumulative count of Article Views (full-text article views including HTML views, PDF and ePub downloads, according to the available data) and Abstracts Views on Vision4Press platform.
Data correspond to usage on the plateform after 2015. The current usage metrics is available 48-96 hours after online publication and is updated daily on week days.
Initial download of the metrics may take a while.