Fig. 10
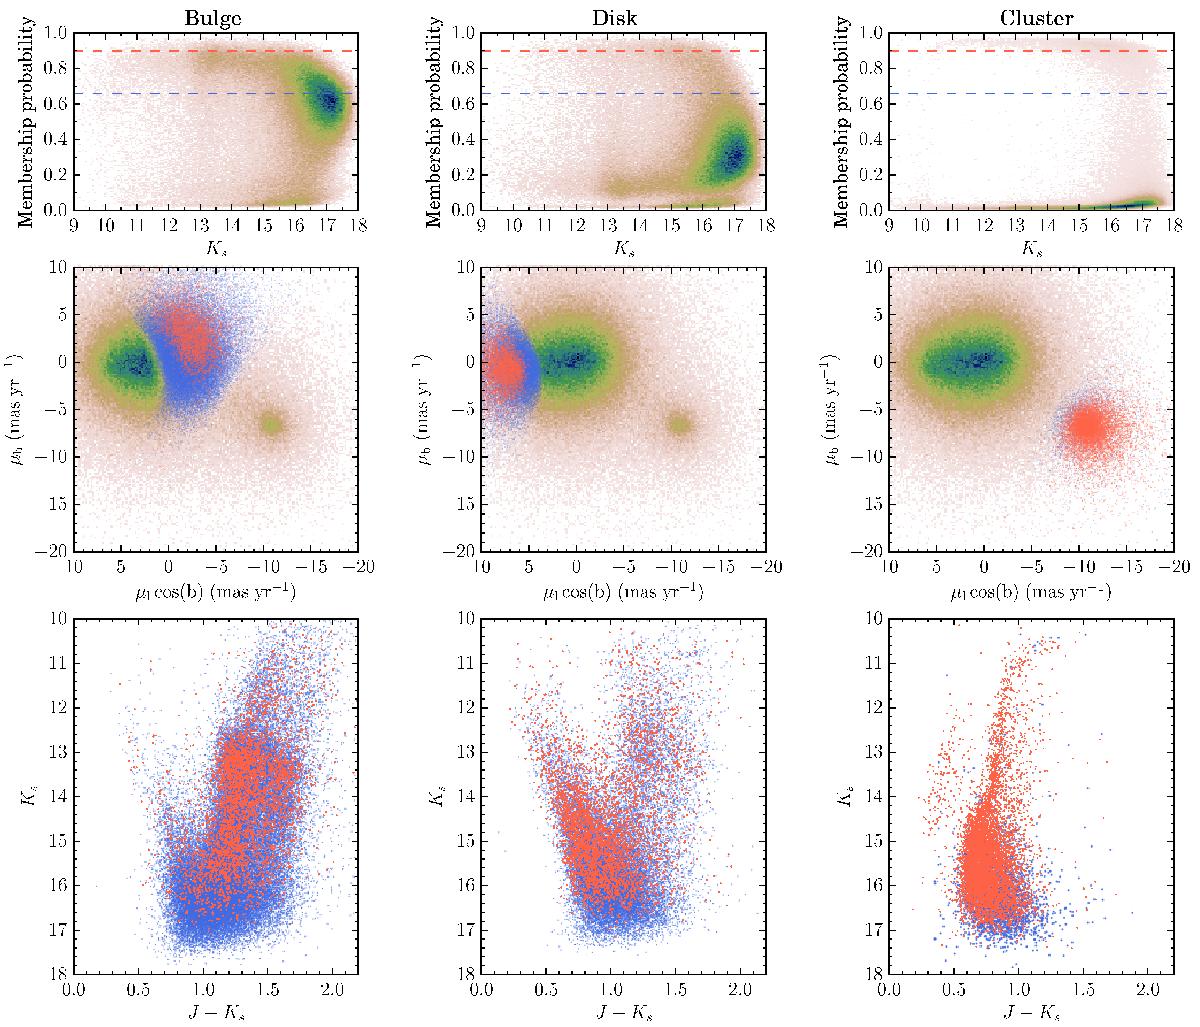
Upper row: membership probability as a function of magnitude for the bulge, disk and cluster, color coded by point density. The blue and red dashed lines depict the p = 0.66 and p = 0.90 levels used to select likely members of the respective components of the mixture. Middle row: VPD of the whole sample is displayed identically in each panel, color coded by density. The blue and red points stand for subsamples of bulge, disk, and cluster stars selected as those with membership probabilities to the respective component larger than p = 0.66 and p = 0.90 (and with error in their probabilities smaller than 0.35). Lower row: CMD for the most probable members of the bulge, disk and cluster, color coded as above.
Current usage metrics show cumulative count of Article Views (full-text article views including HTML views, PDF and ePub downloads, according to the available data) and Abstracts Views on Vision4Press platform.
Data correspond to usage on the plateform after 2015. The current usage metrics is available 48-96 hours after online publication and is updated daily on week days.
Initial download of the metrics may take a while.