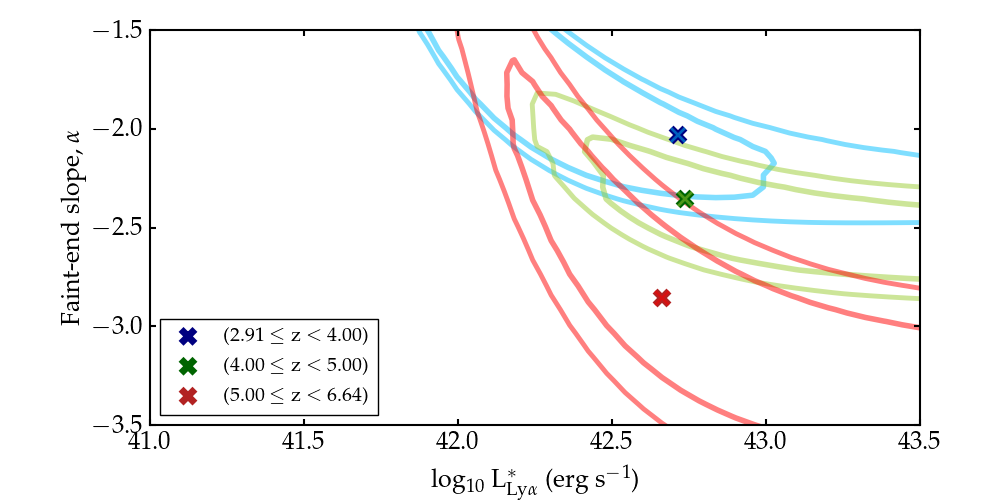
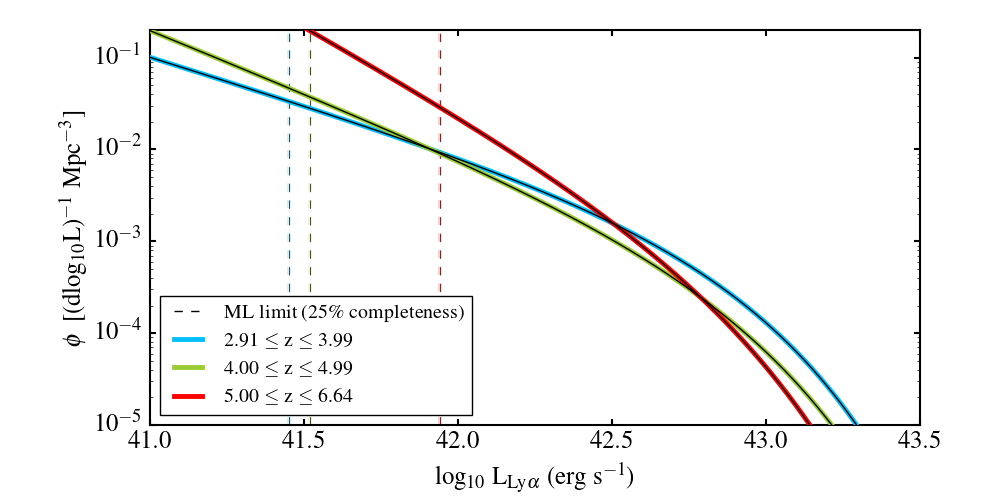
Fig. 8
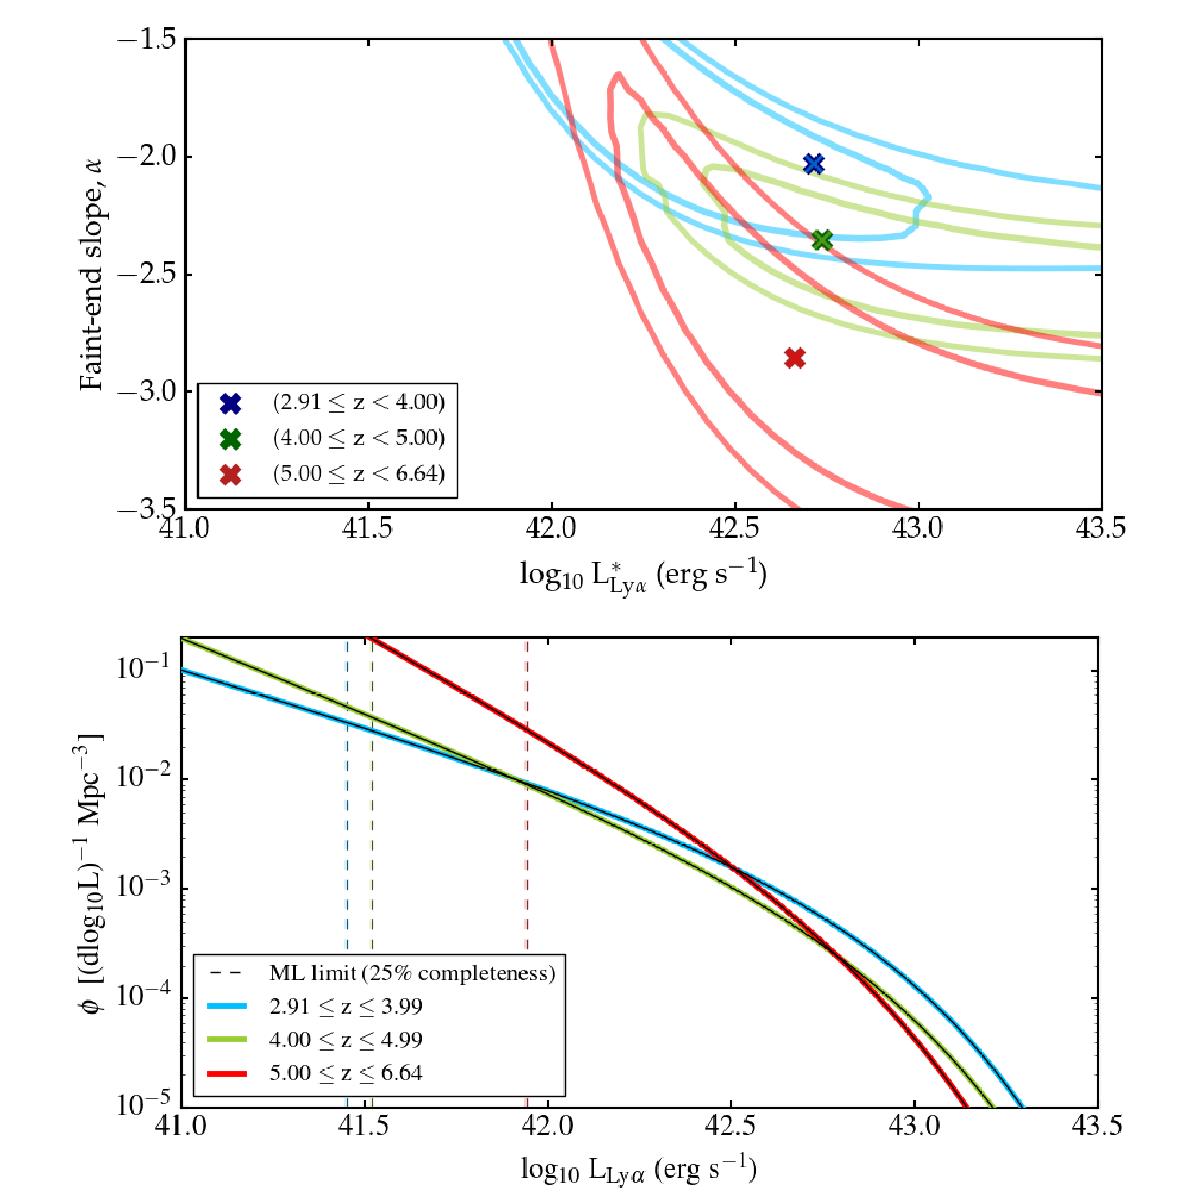
Maximum likelihood Schechter luminosity functions for three redshift bins 2.91 ≤ z < 4.00, blue; 4.00 ≤ z < 5.00, green; 5.00 ≤ z < 6.64, red. In the upper panel we show 68% and 95% joint confidence regions which correspond to ΔS=2.30 and 6.18 for two free fit parameters (L∗ and α). In the lower panel we show the maximum likelihood Schechter functions as solid lines.
Current usage metrics show cumulative count of Article Views (full-text article views including HTML views, PDF and ePub downloads, according to the available data) and Abstracts Views on Vision4Press platform.
Data correspond to usage on the plateform after 2015. The current usage metrics is available 48-96 hours after online publication and is updated daily on week days.
Initial download of the metrics may take a while.