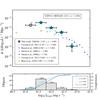
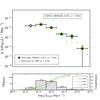
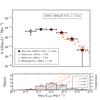
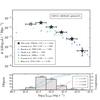
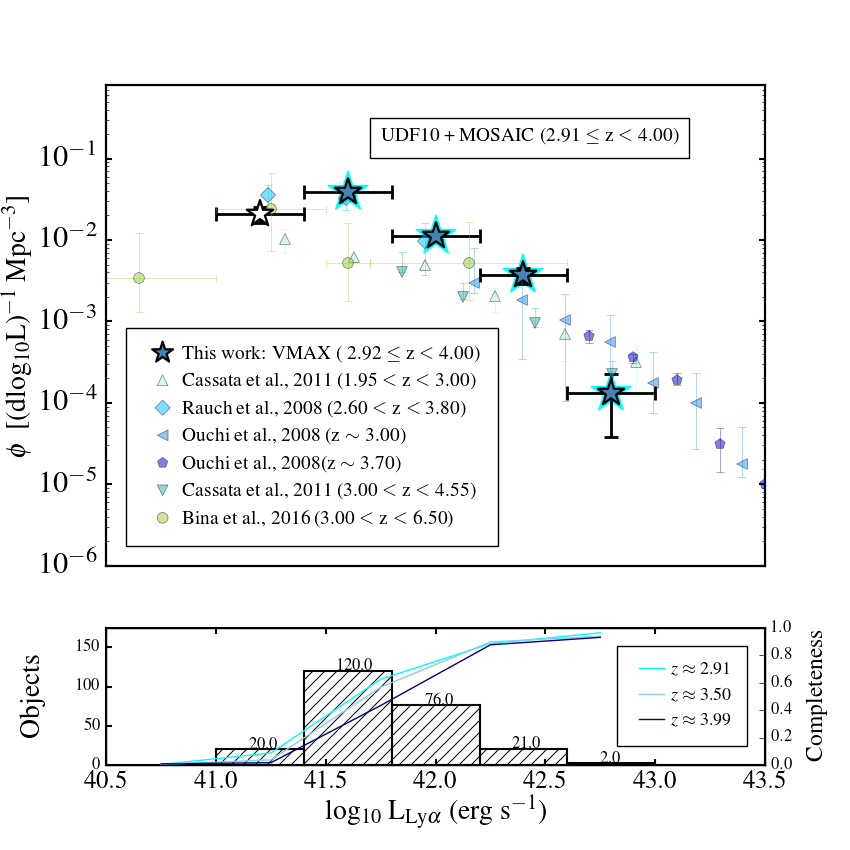
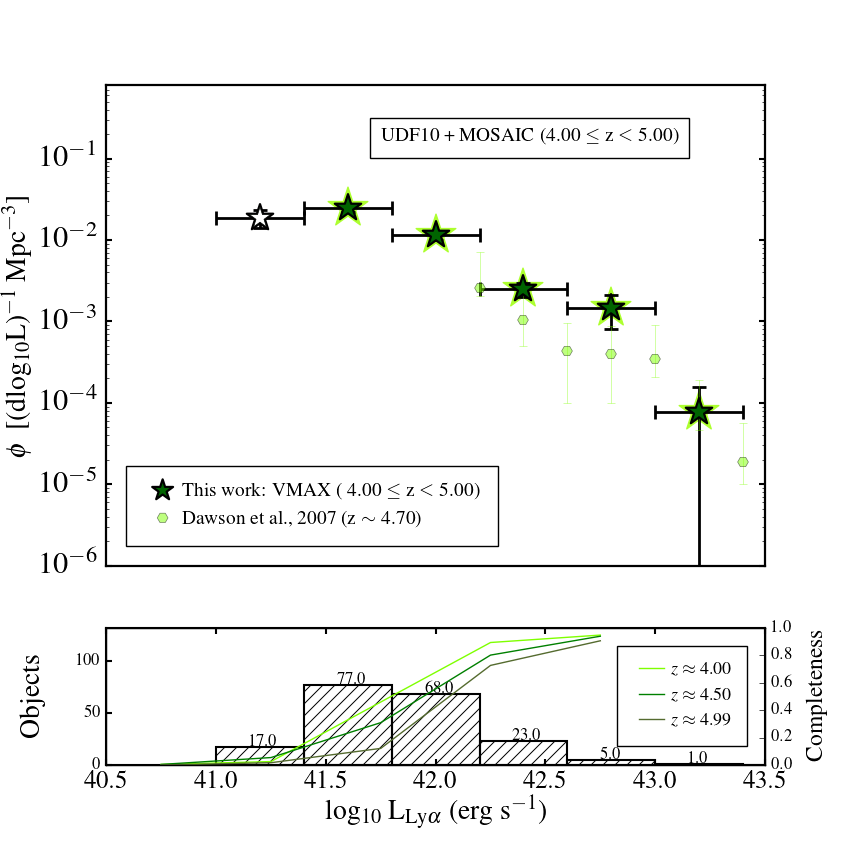
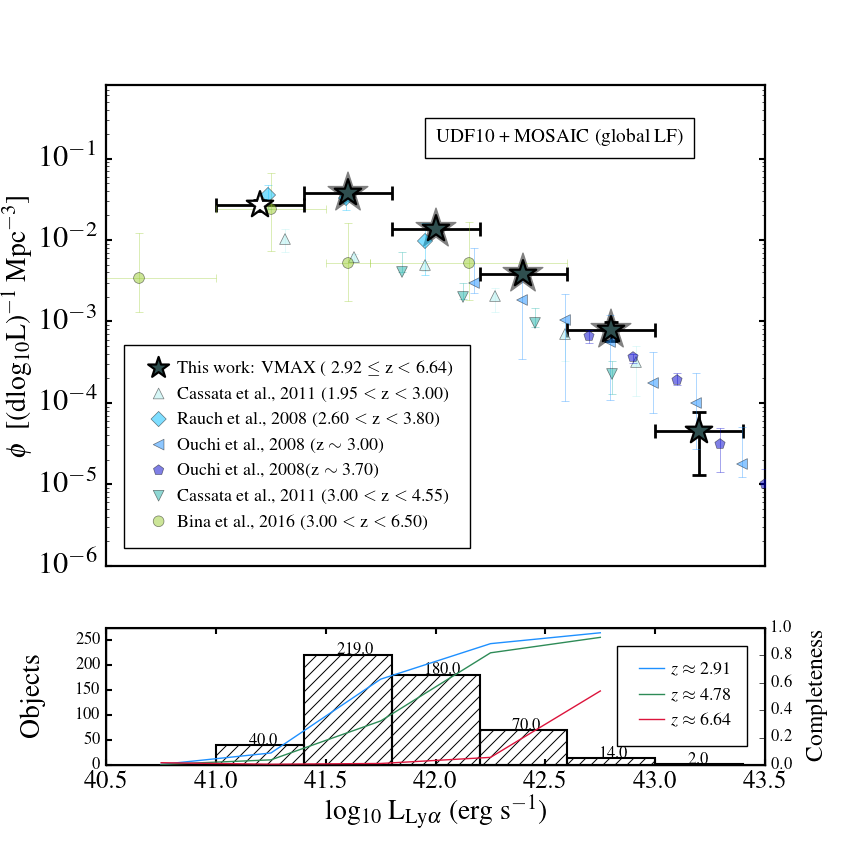
Fig. 6
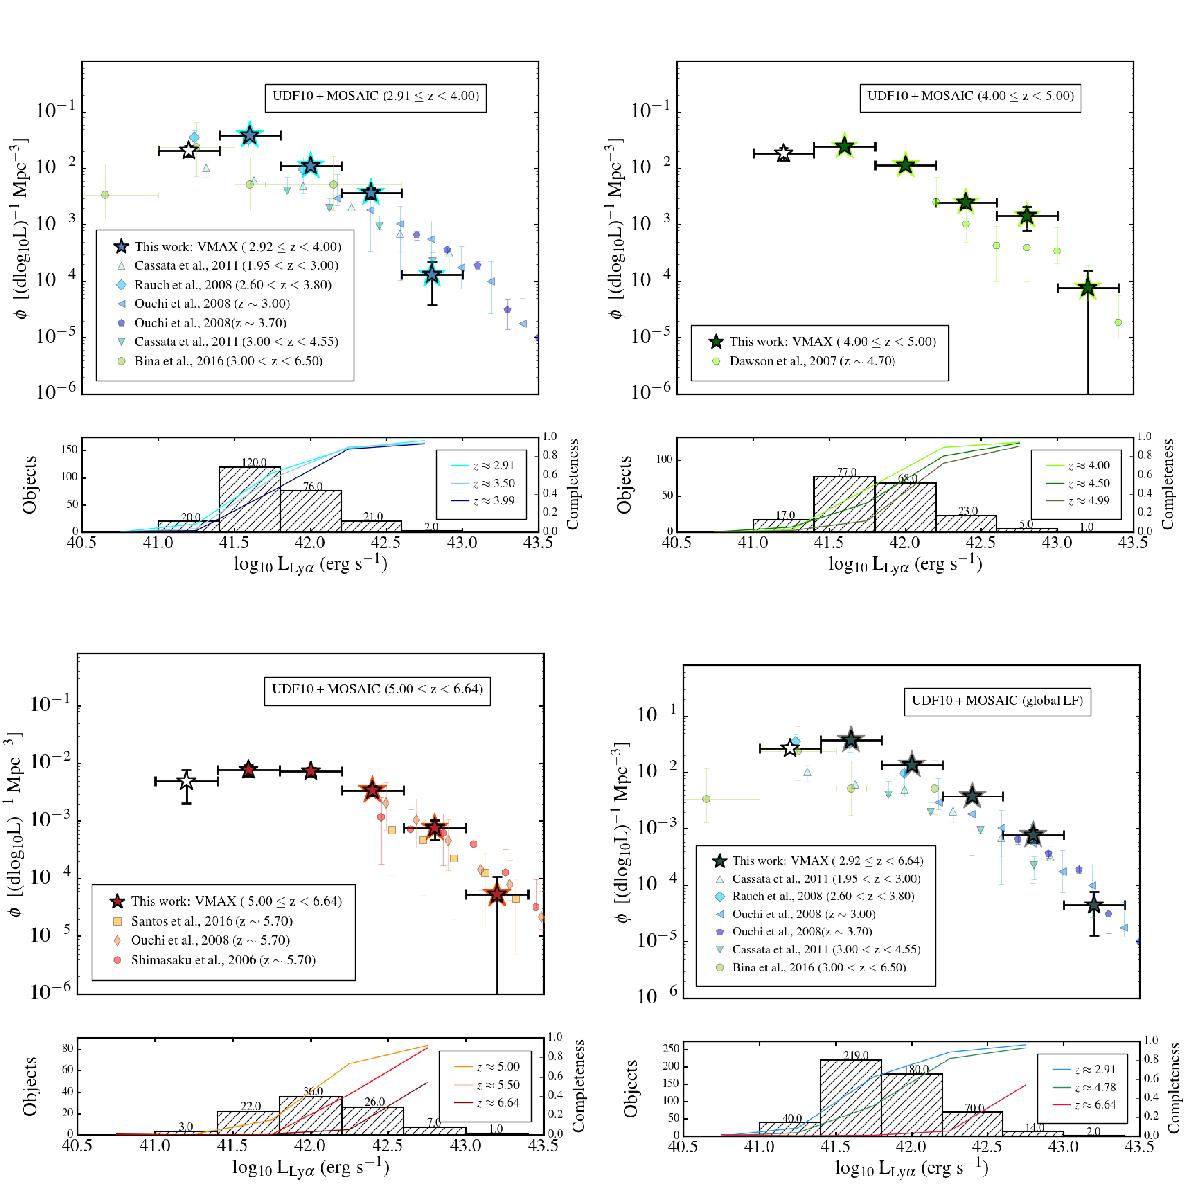
Number densities resulting from the 1 /Vmax estimator. Top left: 2.91 ≤ z< 4.00 bin, blue; top right: 4.00 ≤ z< 5.00 bin, green; bottom left: 5.00 ≤ z< 6.64 bin, red; bottom right: all LAEs 2.91 ≤ z< 6.64. In each panel we show number densities in bins of 0.4 dex, together with literature results at similar redshifts from narrowband or long-slit surveys. In the lower part of each panel we show the histogram of objects in the redshift bin overlaid with the completeness estimate for extended emitters at the lower, middle and highest redshift in each bin. In each panel we flag incomplete bins with a transparent datapoint. Errorbars represent the 1σ Poissonian uncertainty, we note that often the ends of the bars are hidden behind the data point itself.
Current usage metrics show cumulative count of Article Views (full-text article views including HTML views, PDF and ePub downloads, according to the available data) and Abstracts Views on Vision4Press platform.
Data correspond to usage on the plateform after 2015. The current usage metrics is available 48-96 hours after online publication and is updated daily on week days.
Initial download of the metrics may take a while.