Fig. 4
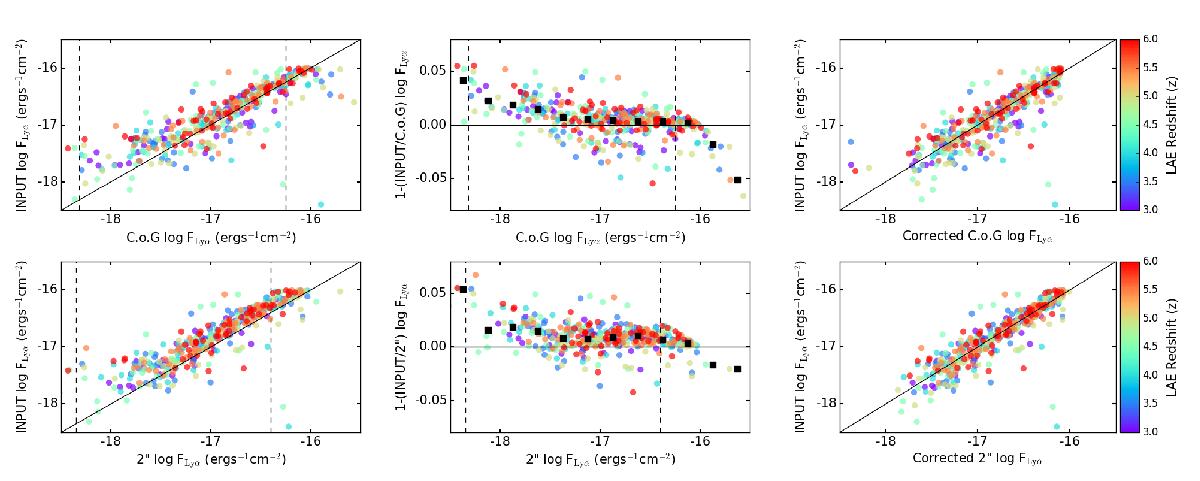
Bias in flux estimation for C.o.G (upper row) and 2′′ aperture (lower row) measurements in the UDF-10 field. In the first column of panels we show a comparison between the input total flux on the ordinate and the recovered flux on the abscissa. In the central column of panels we show the difference between input and recovered flux on the ordinate as a function of recovered flux on the abscissa, where the black squares indicate the median value of the offset, which increases rapidly towards lower fluxes. In each of the first two columns of panels we depict the minimum and maximum fluxes of objects detected in the MUSELET catalogue with dashed lines. In the final column of panels we show values of measured flux corrected for the median offset using measurements from the central columns.
Current usage metrics show cumulative count of Article Views (full-text article views including HTML views, PDF and ePub downloads, according to the available data) and Abstracts Views on Vision4Press platform.
Data correspond to usage on the plateform after 2015. The current usage metrics is available 48-96 hours after online publication and is updated daily on week days.
Initial download of the metrics may take a while.