Fig. 2
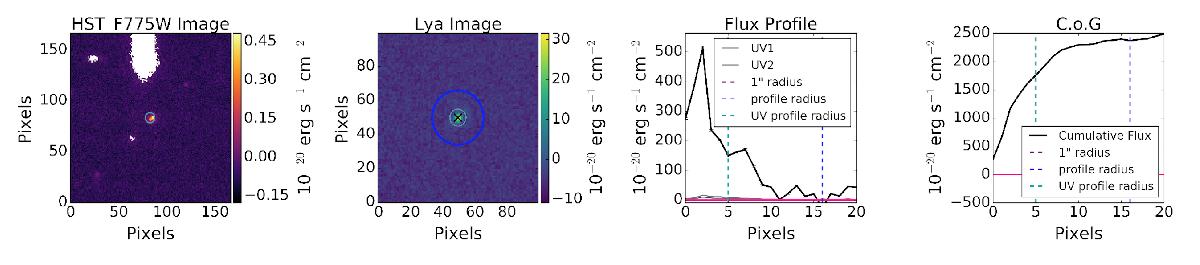
Example of flux estimation for object 149 in the udf-10 field. In the first panel we show the HST image corresponding to the wavelength of Lyα, in the second panel we show the narrowband image extracted from the MUSE cube. In the third panel we show the flux profile of the galaxy determined according to the method described in Sect. 3.1, and in the fourth panel we show the cumulative flux determined by summing the results in Sect. 3.1. The dashed vertical lines in the third and fourth panels show the 1″ radius, and the different radii encompassing the total flux according to a curve of growth analysis on either the HST or the MUSE images.
Current usage metrics show cumulative count of Article Views (full-text article views including HTML views, PDF and ePub downloads, according to the available data) and Abstracts Views on Vision4Press platform.
Data correspond to usage on the plateform after 2015. The current usage metrics is available 48-96 hours after online publication and is updated daily on week days.
Initial download of the metrics may take a while.