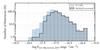
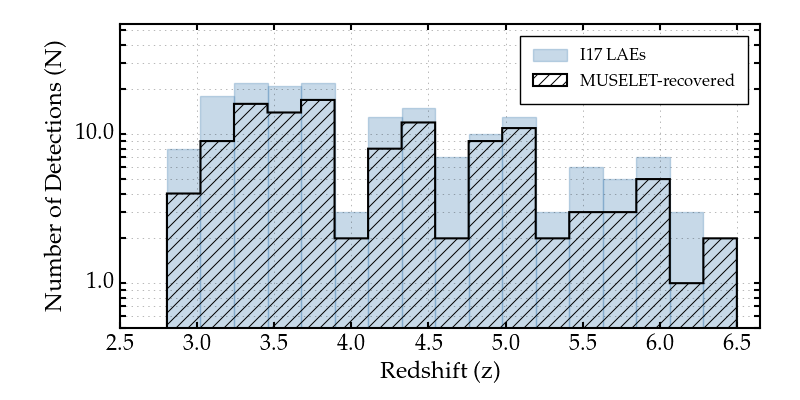
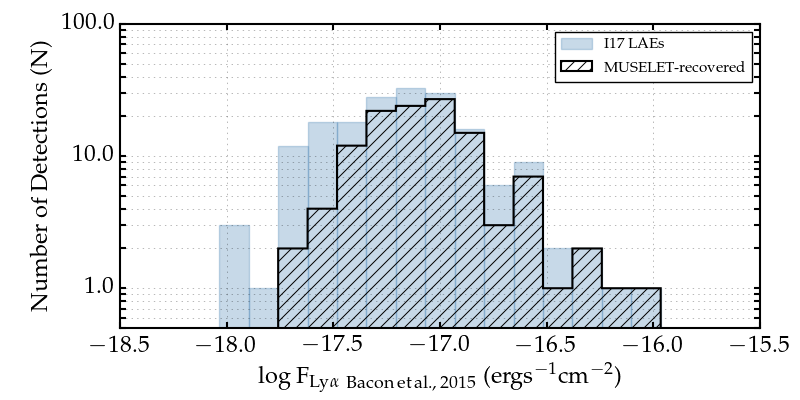
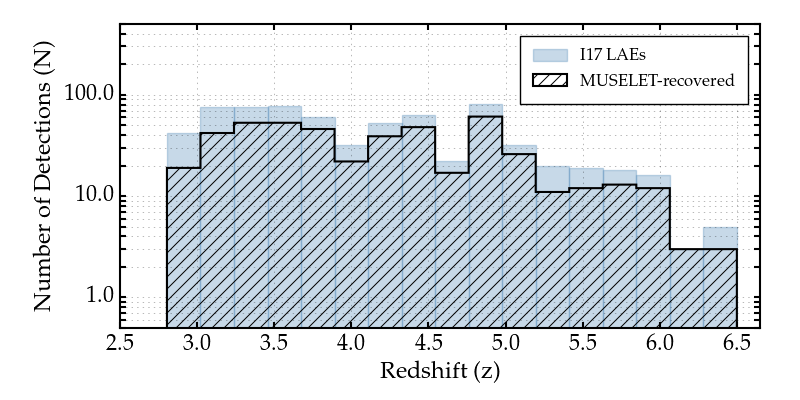
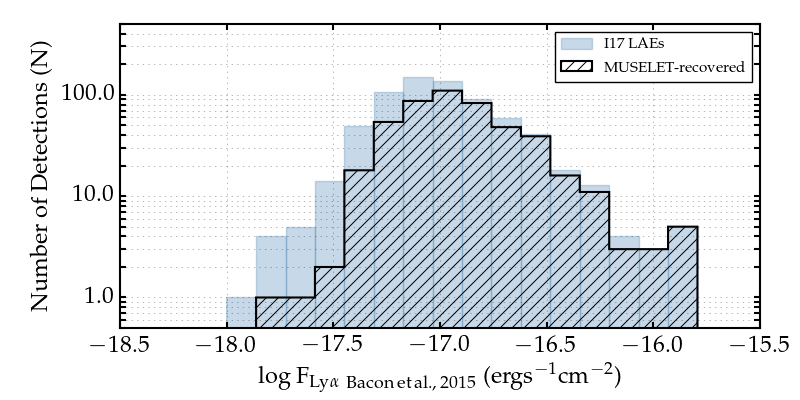
Fig. 1
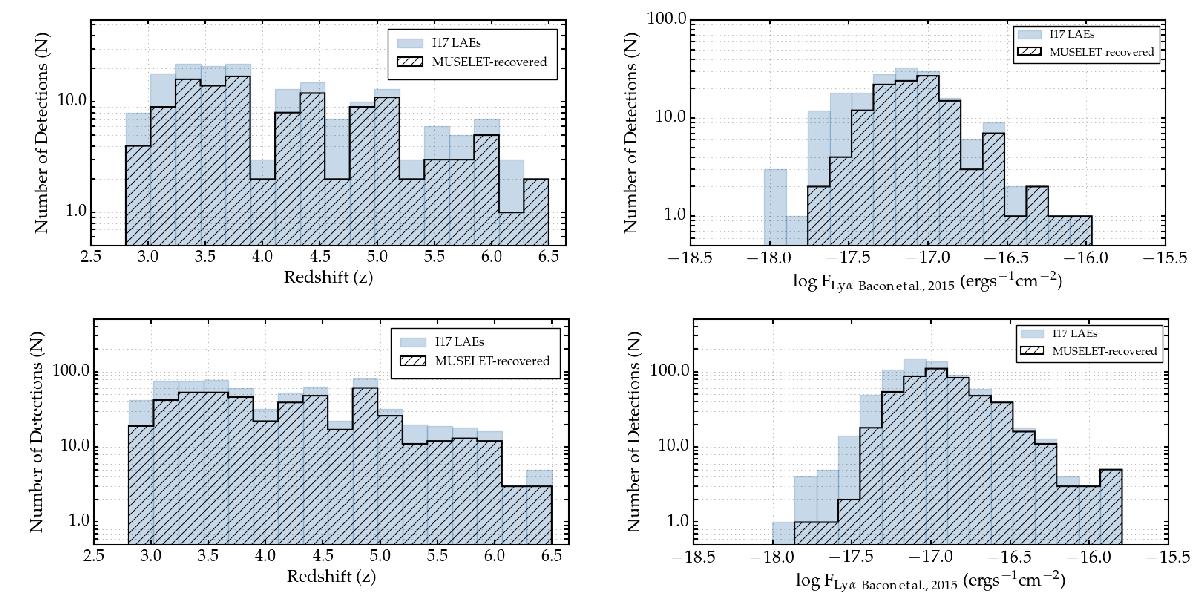
Detections using our detection software muselet, overplotted on the LAEs discovered and catalogued in I17. In the left-hand panels (upper udf-10, lower mosaic) we show the redshift distributions, demonstrating an even recovery rate across the entire redshift range. In the right-hand panels (upper udf-10, lower mosaic) we use the published flux estimates of I17 to show the distribution of fluxes recovered by muselet vs. the distribution for I17 LAEs.
Current usage metrics show cumulative count of Article Views (full-text article views including HTML views, PDF and ePub downloads, according to the available data) and Abstracts Views on Vision4Press platform.
Data correspond to usage on the plateform after 2015. The current usage metrics is available 48-96 hours after online publication and is updated daily on week days.
Initial download of the metrics may take a while.