Fig. 1
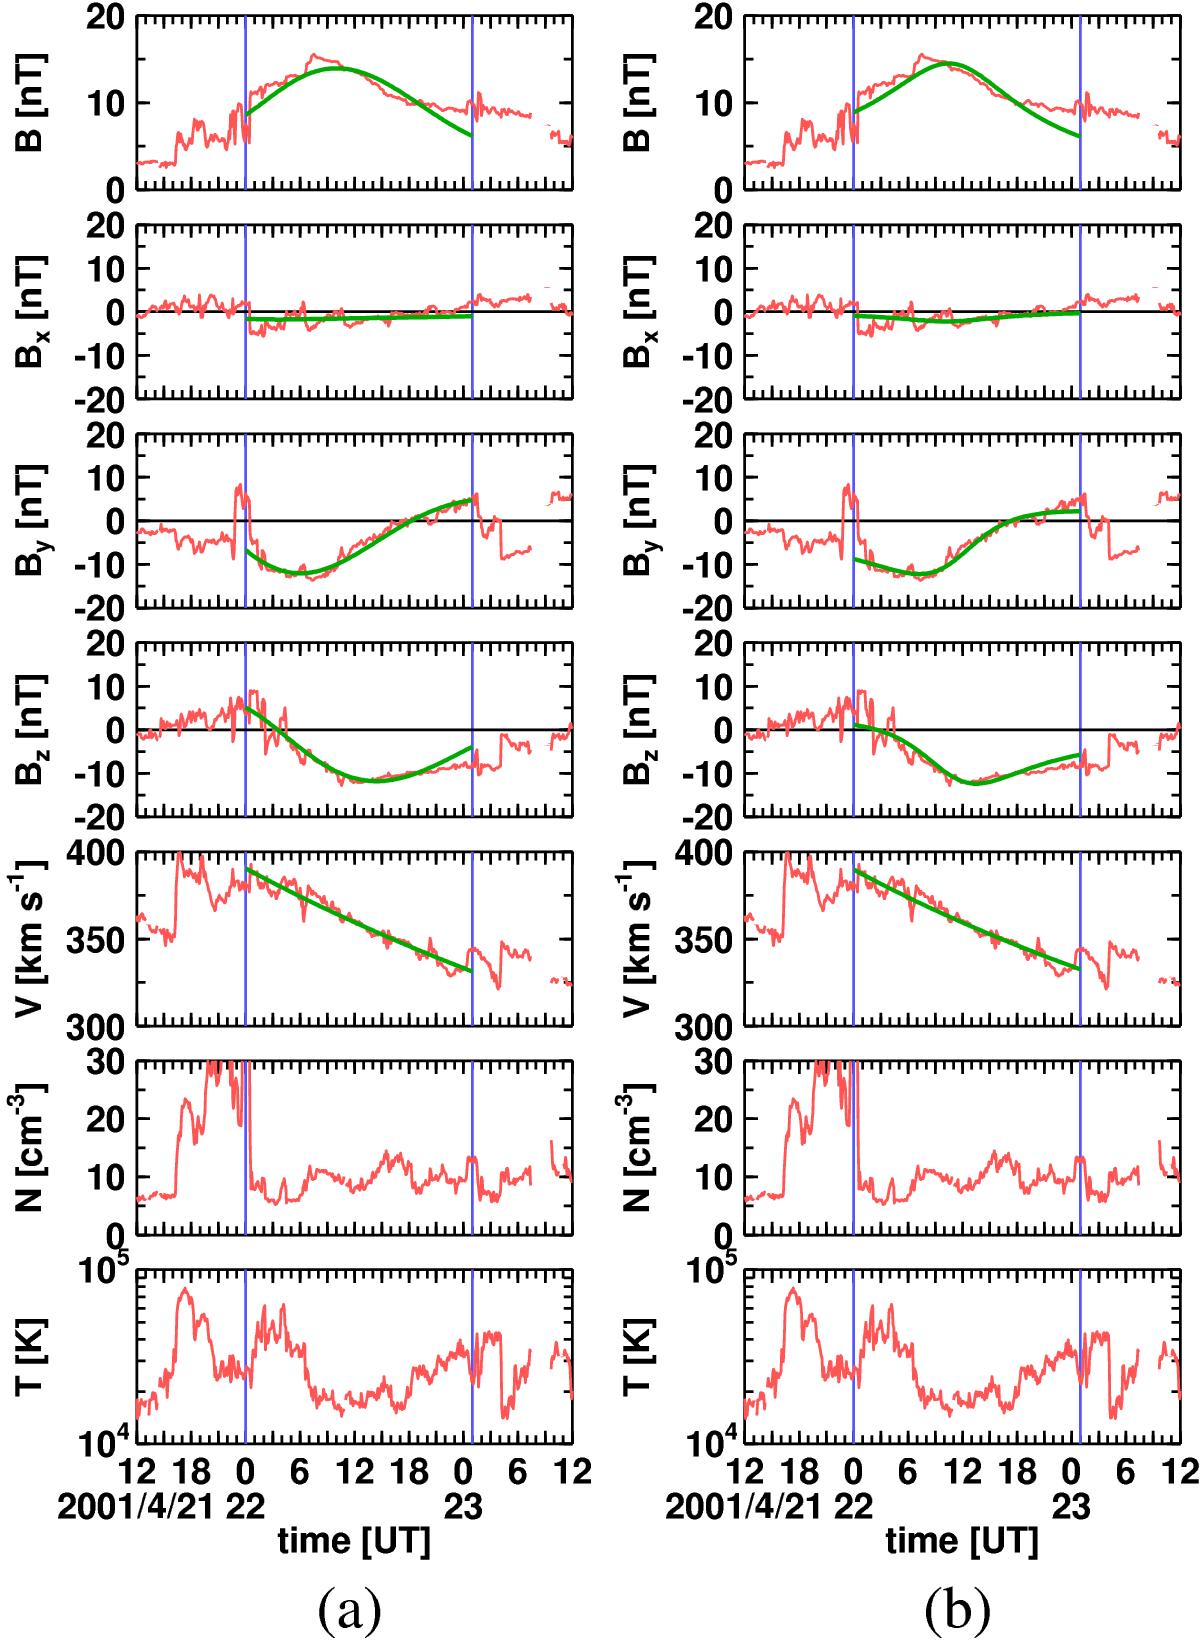
Magnetic cloud of April 22, 2001. Observations (5-min averages) are plotted by the red lines, B, Bx, By, and Bz are the magnetic field magnitude and the field components in the GSE coordinates, V, N, and T are the solar wind velocity, proton number density, and proton temperature, respectively. Estimated cloud boundaries are drawn by the blue vertical lines. The thick green lines are fits by cylindrical models, namely a) the (spatially) constant-α force-free field (the Lundquist solution) with expansion, and b) (spatially) uniform-twist field (the Gold-Hoyle tube) with expansion.
Current usage metrics show cumulative count of Article Views (full-text article views including HTML views, PDF and ePub downloads, according to the available data) and Abstracts Views on Vision4Press platform.
Data correspond to usage on the plateform after 2015. The current usage metrics is available 48-96 hours after online publication and is updated daily on week days.
Initial download of the metrics may take a while.