Fig. 9
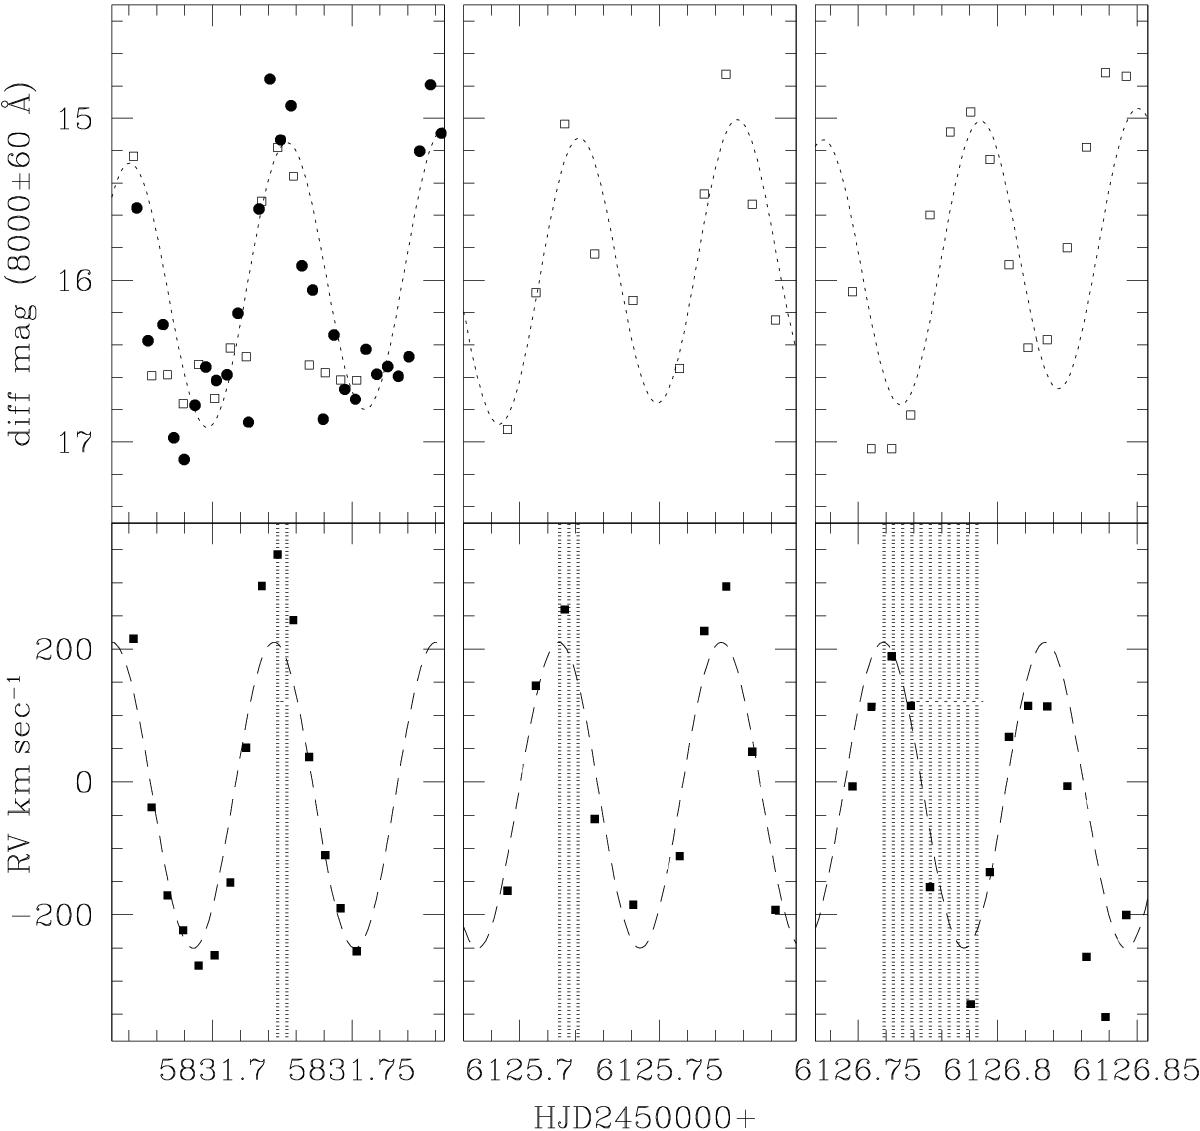
Bottom panels: measurements of the RV of IGR 1955+0044 at three separate epochs (filled squares) with a sine fit corresponding to the fo orbital frequency. Top panels: measurements of the continuum flux in a band around 8000 Å (open squares) and I-band magnitudes (filled dots) at the same epochs. The data are fitted with a sum of sine functions with fs + 2(fs−fo) frequencies corresponding to the spin and strongest beat frequency. The shaded strips in the bottom panels denote the varying shift between phases (maximum RV vs. maximum brightness) caused by the difference of the orbital and spin frequencies.
Current usage metrics show cumulative count of Article Views (full-text article views including HTML views, PDF and ePub downloads, according to the available data) and Abstracts Views on Vision4Press platform.
Data correspond to usage on the plateform after 2015. The current usage metrics is available 48-96 hours after online publication and is updated daily on week days.
Initial download of the metrics may take a while.