Fig. 5
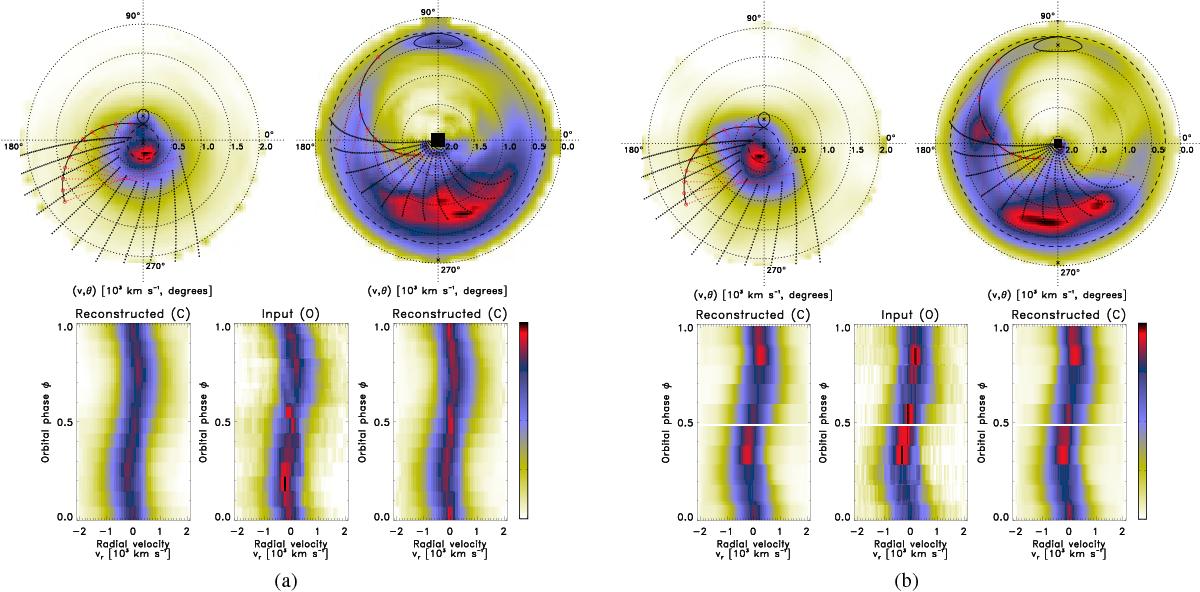
Standard and inside-out Doppler tomography based on the Hα emission (a) and the Hβ emission (b). For each spectral line a pair of maps in the top panels show the standard tomogram (left side) and the inside-out tomogram (right side). In the bottom panel, three frames accompany maps of each line. They are comprised of the middle frame showing the observed trailed spectra with the reconstructed spectra for the standard and inside out cases to the left and right, respectively. See text for details.
Current usage metrics show cumulative count of Article Views (full-text article views including HTML views, PDF and ePub downloads, according to the available data) and Abstracts Views on Vision4Press platform.
Data correspond to usage on the plateform after 2015. The current usage metrics is available 48-96 hours after online publication and is updated daily on week days.
Initial download of the metrics may take a while.