Fig. 4
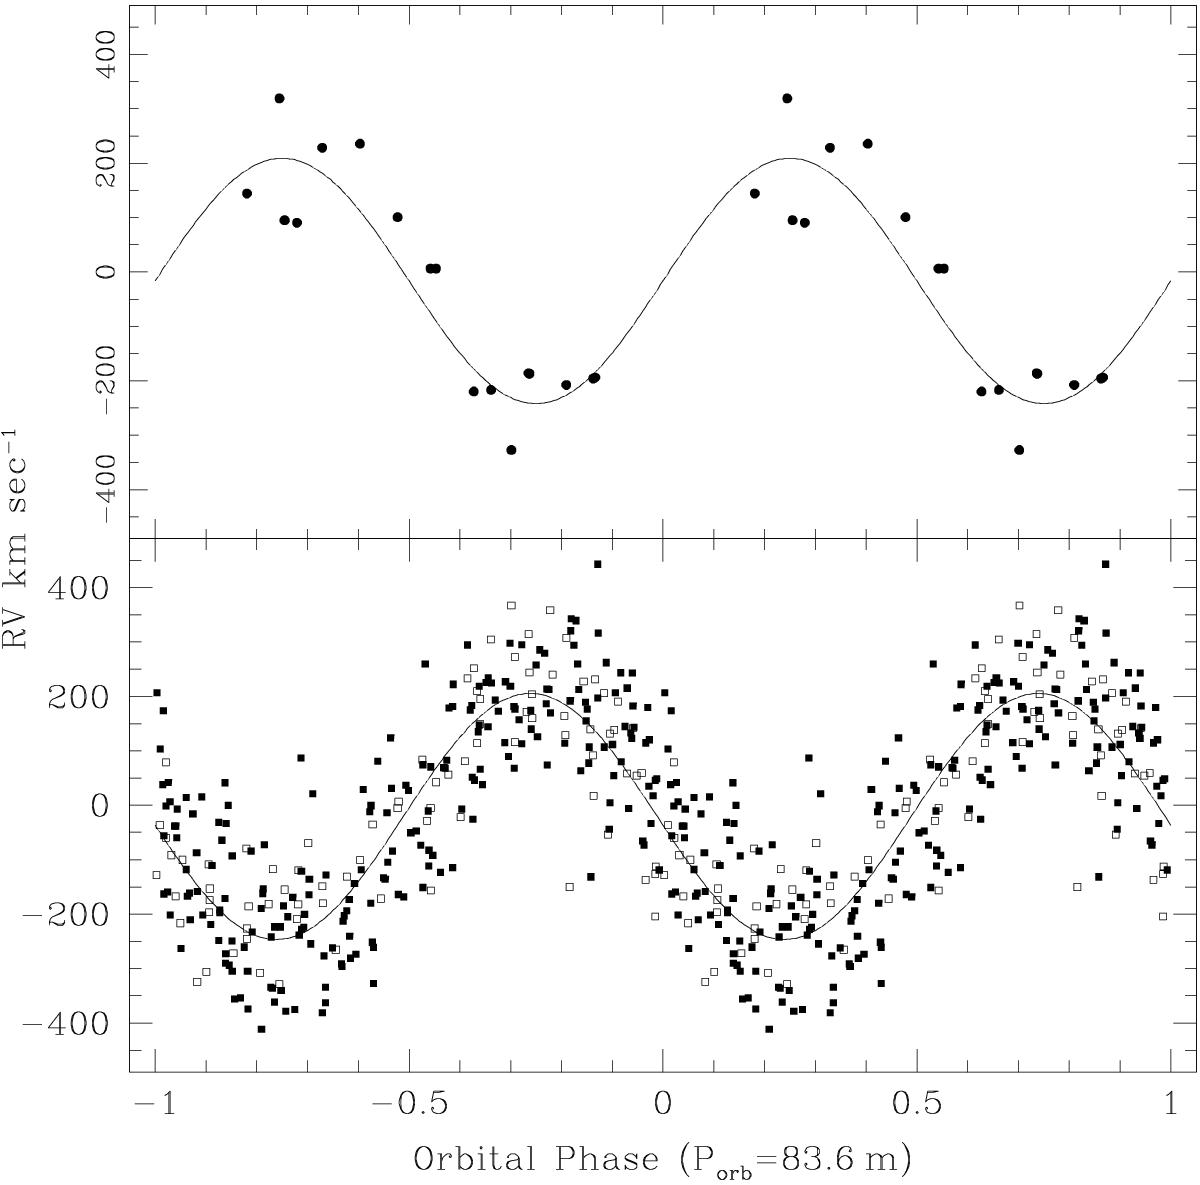
Radial velocity curves of IGR 1955+0044. Bottom panel: single Gaussian measurements of Hβ fitted with a sine curve are shown. The filled squares are data obtained at SPM; the open squares are from MDM. Top panel: the measurement of the narrow component of the Hα line wherever we were able to distinguish it in the line profile, is shown. The sine curve with fixed period determined from the Hβ analysis was used to fit to these points. There is a small phase shift of the Hβ RV curve from being totally opposite to that of Hα.
Current usage metrics show cumulative count of Article Views (full-text article views including HTML views, PDF and ePub downloads, according to the available data) and Abstracts Views on Vision4Press platform.
Data correspond to usage on the plateform after 2015. The current usage metrics is available 48-96 hours after online publication and is updated daily on week days.
Initial download of the metrics may take a while.