Free Access
Fig. 10
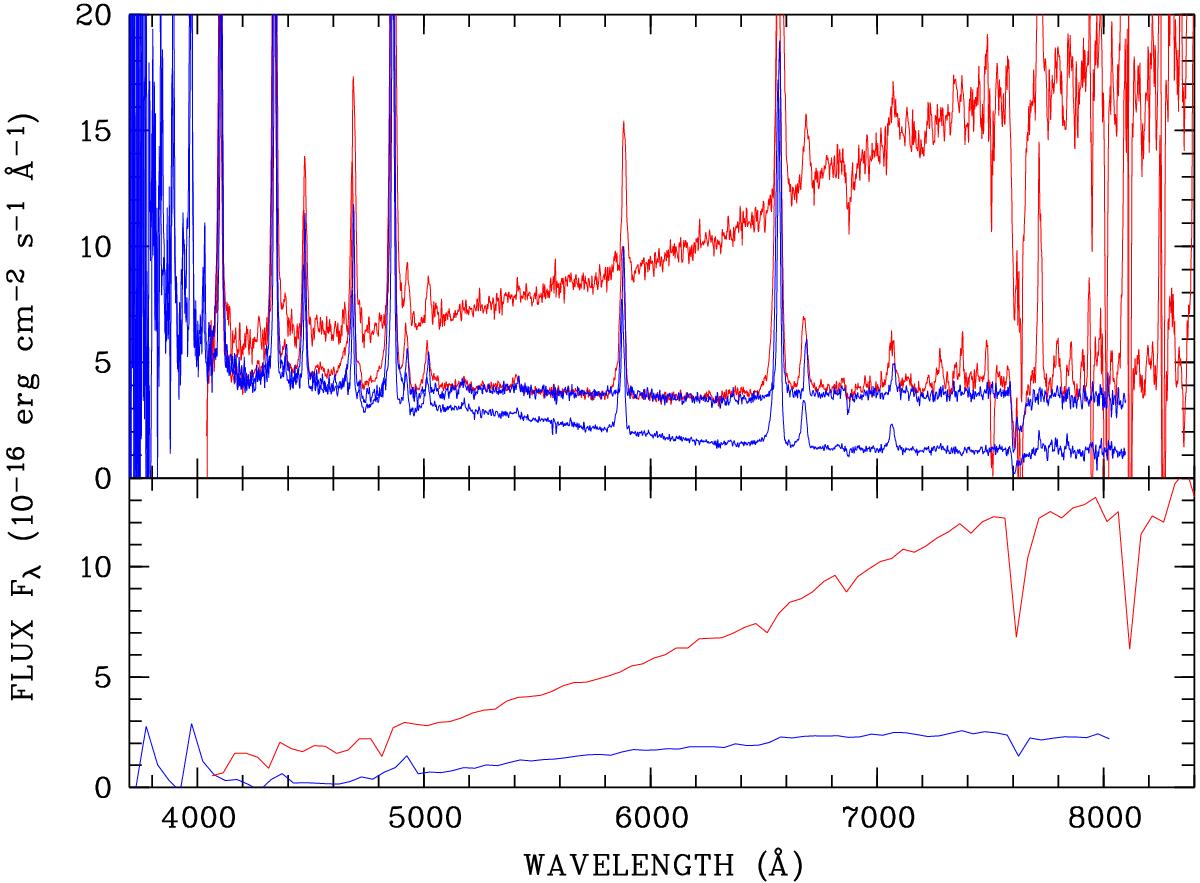
Top panel: low-resolution spectra of IGR 1955+0044 obtained in 2011 (blue) and 2012 (red) at maximum and minimum brightness. Bottom panel: cyclotron spectra in 2011 and 2012 are shown.
Current usage metrics show cumulative count of Article Views (full-text article views including HTML views, PDF and ePub downloads, according to the available data) and Abstracts Views on Vision4Press platform.
Data correspond to usage on the plateform after 2015. The current usage metrics is available 48-96 hours after online publication and is updated daily on week days.
Initial download of the metrics may take a while.