| Issue |
A&A
Volume 608, December 2017
|
|
|---|---|---|
| Article Number | A119 | |
| Number of page(s) | 14 | |
| Section | Extragalactic astronomy | |
| DOI | https://doi.org/10.1051/0004-6361/201731293 | |
| Published online | 13 December 2017 | |
Probing star formation and feedback in dwarf galaxies
Integral field view of the blue compact galaxy Tololo 1937-423⋆
1 Institut für Astrophysik, Georg-August-Universität, Friedrich-Hund-Platz 1, 37077 Göttingen, Germany
e-mail: This email address is being protected from spambots. You need JavaScript enabled to view it.
2 Hamburger Sternwarte, Gojenbergsweg 112, 21029 Hamburg, Germany
e-mail: This email address is being protected from spambots. You need JavaScript enabled to view it.
Received: 2 June 2017
Accepted: 14 August 2017
Abstract
Context. Blue compact galaxies (BCG) are gas-rich, low-mass, small systems that form stars at unusually high rates. This makes them excellent laboratories for investigating the process of star-formation (SF) at galactic scales and the effects of massive stellar feedback on the interstellar (and intergalactic) medium.
Aims. We analyzed the BCG Tololo 1937-423 using optical integral field spectroscopy to probe its morphology, stellar content, nebular excitation and ionization properties, and the kinematics of its warm ionized gas.
Methods. Tololo 1937-423 was observed with the Visible Multi-Object Spectrograph at the Very Large Telescope. We took data in the wavelength range 4150–7400 Å, covering a field of view of 27″× 27″ on the sky with a spatial sampling of 0.̋67. From these data we built maps in the continuum and brighter emission lines, diagnostic line ratio maps, and velocity dispersion fields. We also generated the integrated spectrum of the main H ii regions and young stellar clusters to determine reliable physical parameters and oxygen abundances.
Results. We found that Tololo 1937-423 is currently undergoing an extended starburst. In the Hα maps we identified nine major clumps, aligned mostly northeast-southwest, and stretching to galactocentric distances ≥2 kpc. The galaxy presents a single continuum peak that is not cospatial with any knot in emission lines, indicating at least two relatively recent episodes of SF. The inhomogeneous dust distribution reachs its maximum (E(B−V)~ 0.97) roughly at the position of the continuum peak. We found shocked regions in the galaxy outer regions and at the edges of the SF knots. The oxygen abundance, 12 + log(O/H) ~ 8.20 ± 0.1, is similar in all the SF regions, suggesting a chemically homogeneous ionized interstellar medium over spatial scales of several kpc. The ionized gas kinematics displays an overall regular rotation around a northwest-southeast axis, with a maximum velocity of 70 ± 7 km s-1.
Conclusions. The morphology of the galaxy and the two different episodes of SF suggest a scenario of triggered (induced by supernova shock waves) SF acting in Tololo 1937-423. The inferred ages for the different SF episodes (~13–80 Myr for the central post-starburst and 5–7 Myr for the ongoing SF) are consistent with triggered SF, with the most recent SF episode caused by the collective effect of stellar winds and supernova explosions from the central post-starburst. The velocity dispersion pattern, with higher velocity dispersions found at the edges of the SF regions, and shocked regions in the galaxy, also favor this scenario.
Key words: galaxies: individual: Tololo 1937-423 / galaxies: dwarf / galaxies: star formation / galaxies: kinematics and dynamics / galaxies: abundances
Based on observations made with ESO Telescopes at Paranal Observatory under programme ID 079.B-0445.
© ESO, 2017
1. Introduction
Blue compact galaxies (BCG) have gained ample popularity in extragalactic research, and for good reason, because the study of these small, gas-rich and mostly metal-poor objects provides insights into fundamental questions in contemporary extragalactic astronomy. Because of their low luminosity, compactness (MB≥−18; starburst diameter ≤1 kpc; Thuan & Martin 1981; Cairós et al. 2001), and their unusually high star-forming rates (up to 3 M⊙ yr-1, Fanelli et al. 1988; Hunter & Elmegreen 2004), BCGs are excellent laboratories to investigate the star formation (SF) process in galaxies and the effect of stellar feedback on the surrounding interstellar medium (ISM).
Blue compact galaxies also lack the complex gas dynamics of spirals, that is, neither density waves nor shear forces are at play, which means that the SF process can be studied in a relatively simple environment (Hunter 1997; Hunter & Elmegreen 2004). In addition, these low-mass galaxies have a shallower gravitational potential and lower escape velocities than typical spirals, therefore the effects of feedback processes can be very dramatic. It has indeed been suggested that BCGs could eject a significant fraction of the enriched matter that is returned by supernovae (SN) and winds into the intergalactic medium (IGM; Dekel & Silk 1986; Mac Low & Ferrara 1999), and this feedback has been employed to explain some questions that are still open to discussion, such as the absence of very low-mass galaxies after reionization (Barkana & Loeb 1999), the slope of the galaxy luminosity function (Dekel & Woo 2003), or the mass metallicity relation (Larson 1974).
The importance of these questions prompted us to initiate an integral field spectroscopy (IFS) analysis of a BCG sample, aiming primarily at understanding their recent SF and the effect of the massive stellar population on the surrounding ISM (Cairós et al. 2009b,a, 2010, 2012, 2015). The first data products from this work, which included emission and diagnostic line maps, interstellar extinction maps and velocity fields, generated interesting results and some intriguing new questions, which necessitated further work. As a consequence, our next step has been to select a subsample of objects on the basis of our results, which is to be the subject of a series of individual studies. Investigations of large samples are essential to open a new research field, establish general trends and find correlations among fundamental parameters, but detailed analyses of individual objects are needed to better understand the physical processes underlying galaxy parameters and behaviors.
This is the second in the series of papers presenting the analysis of individual galaxies; results for the BCG Haro14 have been published recently (Cairós & González-Pérez 2017). Here we investigate the BCG Tololo 1937-423, an object that has not received much attention so far. It is included in the spectrophometric catalogs of H ii galaxies by Terlevich et al. (1991) and Kehrig et al. (2004) and in the study of stellar populations in a sample of H ii galaxies by Westera et al. (2004). Surface photometry in B and R has been presented in Doublier et al. (1999), Gil de Paz et al. (2003), and Gil de Paz & Madore (2005). Broadband frames of the galaxy reveal a central high-surface brightness (HSB) region with blue colors (B−R≈ 0.6, Doublier et al. 1999), from which conspicuous extensions depart toward the northeast and south, in addition to a more extended, red, and regular low surface brightness (LSB) component (see Fig. 1). Hβ narrowband imaging, unfortunately of a limited quality, has been published by Lagos et al. (2007).
Tololo 1937-423 was part of our IFS study of a BCG sample (Cairós et al. 2015), which revealed it as an intriguing object. In particular, the size and morphology of its current episode of SF singled out this galaxy as a perfect target for a further, deeper analysis. Tololo 1937-423 presents a spatially extended episode of SF that is taking place in a number of knots distributed mainly northeast-southwest, in a structure larger than 4 kpc. Curvilinear features resembling bubbles depart from the galaxy center to the northeast and southwest, and smaller SF knots, located in these filaments, suggest an episode of triggered SF. The curvilinear structures and filaments, and the high values of [S ii] λλ6717, 6731/Hα in the galaxy outskirts, which are indicative of shocks, reveal a perturbed ISM. The origin of the perturbation is most probably the collective action of stellar winds and SN explosions.
Basic parameters for Tololo 1937-423.
2. Observations and data processing
2.1. Data collection and reduction
Tololo 1937-423 was observed at the Very Large Telescope (VLT; ESO Paranal Observatory, Chile) with the Visible Multi-Object Spectrograph (VIMOS; Le Fèvre et al. 2003) in its integral field unit (IFU) mode. The observations were made in Visitor Mode in August 2007 with the blue (HR-blue) and orange (HR-orange) grisms in high-resolution mode (dispersion of 0.51 Å pix-1 in the wavelengths range of 4150–6200 Å, and dispersion of 0.60 Å pix-1 in the range 5250–7400 Å). A field of view (FoV) of 27″× 27″ on the sky was mapped with a spatial sampling of  67.
67.
The integration time was 4320 s both with the HR-blue and with the HR-orange grism. The weather conditions were good: the seeing ranged from 0.51–0.93 arcsec when we observed the red part of the spectrum, and from 0.67–1.58 arcsec in the blue. The spectrophotometric standard EG 274 was observed for flux calibration.
The data were processed using the ESO VIMOS pipeline (version 2.1.11) via the graphical user interface Gasgano. The observations and a complete description of the data reduction have been presented in Cairós et al. (2015).
2.2. Building the galaxy maps
We computed the fluxes of the brightest emission lines in each individual spectrum by fitting Gaussian functions to the line profiles. The lines were fit with the Trust-region algorithm for nonlinear least squares, using the task fit of Matlab. The lines Hβ, [O iii]λλ 4959,5007, Hα, [N ii]λλ 6548,6584, and [S ii]λλ 6717,6731 were measured in the spectrum of each spatial element (spaxel). Along with the line flux, the fitting provides the centroid position, line width, continuum, and their corresponding uncertainties.
A single-Gaussian profile fit was used in all but in the Hβ line. Direct measurements of the emission fluxes of the Balmer lines underestimate the real value, since their fluxes are affected by underlying stellar absorption (McCall et al. 1985; Olofsson 1995). The underlying stellar component, often visible in the spectra as pronounced absorption wings around the lines in emission, adds to the emission flux, decreasing its final value; this absorption can be significant: single stellar populations models predict equivalent width values of between 2 and 15 Å (Olofsson 1995; González Delgado et al. 1999). To account for this effect in Hβ, where absorption wings are clearly seen, we fit the line profile using two Gaussian functions (one in emission and one in absorption) and derived the absorption and emission fluxes simultaneously. In Hα the absence of absorption features in the observed spectrum makes a reliable decomposition impossible, and an alternative approach must be adopted. We assumed the equivalent width in absorption in Hα to be equal to the absorption in Hβ, an assumption well supported by the predictions of evolutionary synthesis models (Olofsson 1995).
A spatial smoothing was applied to increase the accuracy of the fits in regions of LSB. Depending on the signal-to-noise ratio (S/N) of the spaxel, the closest 5, 9, or 13 spaxels were averaged before the fit was carried out. This procedure preserves the spatial resolution of the bright regions of the galaxy while providing a reasonable S/N in the faint parts, although at a lower spatial resolution.
The parameters derived from the fit (line fluxes, centroid position, line width, and continuum) were then used to build the bidimensional maps of the galaxy, taking advantage of the fact that the combined VIMOS data are arranged in a regular 44 × 44 matrix.
The continuum map was produced by summing over the whole spectral range, but masking the spectral regions with significant contributions of emission and telluric lines.
Line ratio maps for lines falling within the wavelength range of either grism were derived by simply dividing the corresponding flux maps. The Hα/Hβ map was derived after registering and shifting the Hα map to spatially match the Hβ map. The shift was calculated aligning the center of the brighter H ii-regions.
We considered only spaxels with a flux level higher than 3σ when we built the final maps. The Hα/Hβ map (see Sect. 3.2.1) was employed to deredden all the emission line flux maps on a spaxel to spaxel basis.
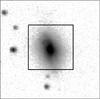 |
Fig. 1 B-band image of Tololo 1937-423. The FoV is 1 arcmin; the 27″×27″ VIMOS FoV is overplotted. North is up and east to the left. The image, retrieved from NED, has been published by Gil de Paz et al. (2003). |
3. Results
Figure 1 shows the B-band image of Tololo 1937-423, with the 27″×27″ VIMOS FoV overplotted. At the galaxy distance, 41.1 Mpc, the spatial scale is 199 pc arcsec-1, with VIMOS we also map about 5.4 × 5.4 kpc2, with a spatial resolution of about 133 pc per spaxel.
3.1. Stellar and warm ionized gas distribution
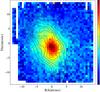 |
Fig. 2 Tololo 1937-423 continuum map constructed by summing over the whole orange spectral range, but masking the emission lines. Contours in Hα flux are overplotted. The image is scaled in arbitrary flux units. The FoV is ~5.4 × 5.4 kpc2, with a spatial resolution of about 133 pc per spaxel; north is up and east to the left, also in all the maps shown from here on. |
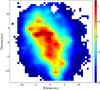 |
Fig. 3 Hα emission line flux map for Tololo 1937-423 in logarithmic scale (flux units are 10-18 erg s-1 cm-2). The cross indicates the position of the continuum peak. |
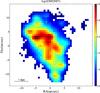 |
Fig. 4 [O iii]λ5007 emission line flux map for Tololo 1937-423. |
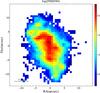 |
Fig. 5 [N ii]λ6584 emission line flux map for Tololo 1937-423. |
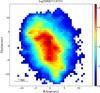 |
Fig. 6 [S ii]λλ6717, 6731 emission line flux map for Tololo 1937-423. |
The continuum intensity of Tololo 1937-423 increases steeply toward the inner part of the galaxy, where it peaks (Fig. 2). The morphology is distorted in the whole surface brightness range, most probably because the extended SF episode is superposed, and the intensity maximum is situated roughly at the center of the outer isocontours.
The distribution of the warm ionized gas, as revealed by the emission line maps, is more knotty (see Fig. 3). An ensemble of SF regions is distributed along an axis ~ 30° NE–the main SF regions are labeled in Fig. 7. Three bright knots, namely knots a, b, and c, are located north of the continuum peak, forming a curvilinear (arc) structure with a radius of about 530 pc. Knot a, the peak of the Balmer line emission, is displaced by about 6.2 ″ (1.2 kpc) to the northeast of the continuum peak. From the central SF regions, filaments depart southwest and northeast, at about 2.0 and 2.5 kpc, respectively. Four knots (d, e, h, and i) are well visible along the filaments stretching to the southwest, and two other knots (f and g) are detected in the filaments extending northeast of the peak. Indications of faint filaments are visible to the west. Diffuse Hα emission fills almost the entire FoV.
All the emission line maps display a roughly similar pattern (a complete set of maps for Tololo 1937-423 can be found in Cairós et al. 2015), but the intensity maximum depends on the wavelength range: in the recombination lines Hα and Hβ, the emission peaks in knot a, while the high-ionization forbidden line [O iii] peaks in knot b, and the low-ionization [N ii] and [S ii] lines peak in knot c (see Figs. 3 to 6).
Tololo 1937-423 displays a different morphology in the emission line and continuum maps. While the continuum emission is centrally concentrated and presents a single maximum, emission line maps are more extended, and nine main SF regions have been identified, none of them at the spatial position of the continuum peak. Because hydrogen recombination-lines and forbidden lines of metals are generated in the ionized interstellar gas, and because the continuum emission is mostly produced in the photosphere of the stars, the comparison of the emission lines and continuum pattern provides a first glance at the stellar populations. We find at least two different stellar components in Tololo 1937-423, a spatially extended, very young population that ionizes the surrounding gas and is therefore younger than ~10 Myr, and a more evolved and centrally concentrated population.
This morphology suggests that a mechanism of induced SF acts in the galaxy, where an older episode of SF, which took place in the HSB central regions, could have triggered the younger SF episode detected in emission lines. That knots are distributed in curvilinear structures and the distorted emission line morphology also indicates an ISM that is perturbed by the action of SN explosions. In Sect. 4 we investigate such a scenario.
3.2. Line-ratio maps
Specific line ratios can be used to derive information about the dust content, the physical parameters, and the excitation and ionization mechanisms acting in a nebula (Aller 1984; Osterbrock & Ferland 2006). The main advantage of integral field data is that they permit computing these line ratios for every spatial resolution element, to build maps, and from them, to derive the dust, physical parameters, and excitation and ionization distribution across the observed FoV, and in particular, to investigate and quantify their possible spatial variations.
3.2.1. Interstellar extinction pattern
In the optical, the interstellar extinction can be computed from the ratio of the fluxes of the Balmer lines (see also Sect. 3.3). Although Hγ falls into the observed spectral range, we used only the Hα/Hβ ratio to trace the extinction pattern because Hγ, significantly fainter than Hα and Hβ, is also more severely affected by the underlying stellar absorption (Olofsson 1995).
The Hα/Hβ line-ratio map of Tololo 1937-423 is displayed in Fig. 8. The galaxy shows an inhomogeneous extinction pattern, with the maximum situated roughly at the position of the continuum peak, where Hα/Hβ reaches values of up to 6.5 (which translate into an extinction coefficient, C(Hβ) = 0.96, and a color excess, E(B−V) = 0.71). The extinction is relatively high at or very close to the position of all SF regions (Hα/Hβ≥ 4), while ratios close to the theoretical value (Hα/Hβ~ 2.87 for case B with a T = 10 000 K and Ne≤ 100 cm-3, Osterbrock & Ferland 2006) are reached at larger galactocentric distances.
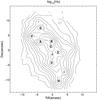 |
Fig. 7 Contour map of the Hα emission in Tololo 1937-423, with the main SF regions labeled. |
The high values of the interstellar extinction and its significant spatial variability agree with previous results for BCGs investigated by means of IFS (Cairós et al. 2009b,a, 2015; Lagos et al. 2009, 2016; James et al. 2013; Cairós & González-Pérez 2017), and stress the importance of information on the dust spatial distribution, even when dealing with small and metal-poor systems such as BCGs. Assuming a single spatial constant value for the extinction, as is usually done for long-slit spectroscopic observations, can lead to significant errors in the fluxes and magnitudes in different galaxy regions. In the case of Tololo 1937-423, for instance, if we were to correct the photometry of knot b with the extinction coefficient derived for the nuclear region, we would derive a (B−V) color ~0.31 mag bluer and a Hα flux 2.3 times higher; for knot g, we would obtain a (B−V) color ~0.40 mag bluer and a Hα flux three times higher. These errors would translate into large errors in ages and star formation rates (SFRs). Uncertainties ≥0.30 mag in the (B−V) color of a young stellar population make this observable useless as an age indicator, as the (B−V) variations are on the same order (0.3−0.4 mag) when the age increases for 0 to 100 Myr. An overestimation of the Hα flux by a factor 3 implies the same factor in the derivation of the SFR.
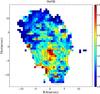 |
Fig. 8 Hα/Hβ ratio map for Tololo 1937-423 with the contours of the Hα flux map overplotted. |
3.2.2. Mapping the electron density
The ratio of the collisionally excited [S ii] λλ6717, 6731 lines is a sensitive electron density (Ne) diagnostic in the range 100−10 000 cm-3 (Aller 1984; Osterbrock & Ferland 2006). A map of the ratio of these lines in Tololo 1937-423 is displayed in Fig. 9.
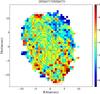 |
Fig. 9 Tololo 1937-423 electron density sensitive [S ii] λ6717/ [S ii] λ6731 emission-line ratio with the Hα contour overplotted. |
In the central part of the galaxy, where the SF is taking place, high ratio values ([S ii] λ6717/[S ii] λ6731≥ 1.35) are uniformily found, indicative of low electron densities (Ne≤ 100 cm-3). In the northwest regions, where the Hα flux is lower, the ratio decreases ([S ii] λ6717/[S ii] λ6731~ 0.9−1.1), indicating densities Ne~ 940−630 cm-3. This density pattern of low-density regions in the SF area and an increasing density toward the galaxy outskirts is consistent with the scenario of a disturbed ISM, in which higher densities are associated with filaments that form in the expanding fronts that are produced by stellar winds and SN explosions. This agrees with the results of Sect. 3.2.4: the regions of higher densities coincide with shocked regions.
3.2.3. Excitation and ionization structure
The two most common power sources responsible for the excitation and ionization of the interstellar gas in emission-line galaxies are high-energy photons from hot stars or an active galaxy nucleus (AGN), and shocks caused by SN explosions and massive stellar winds (Dopita & Sutherland 2003).
Specific emission-line ratios have been proven to be powerful tools to investigate these excitation mechanisms (Baldwin et al. 1981; Veilleux & Osterbrock 1987), the most frequently employed being [O iii] λ5007/Hβ, [N ii] λ6584/Hα, [S ii] λλ6717, 6731/Hα, and [O i] λ6300/Hα. These ratio maps, except for [O i] λ6300/Hα, have been constructed for Tololo 1937-423. Although [O i] λ6300 falls within the observed spectral range, it is severely affected by residuals from the sky subtraction, which hampered a precise determination of its flux.
Figure 10 shows the spatial distribution of the [O iii] λ5007/ Hβ (excitation) map of Tololo 1937-423. High values in this map indicate high ionization. As expected, the excitation peaks are associated with SF regions, that is, with hot (young) massive stars. The excitation values are consistent with photoionization by hot stars in the whole FoV, but noticeable variations appear among different SF knots. The highest excitation ([O iii] λ5007/Hβ up to 3.7) is found in knots a and b, while in knots d, g and i, the values are considerably lower (between 1.2 and 1.6). The [O iii] λ5007/Hβ ratio depends mostly on the hardness of the radiation field (harder fields produce higher excitation) and on the metallicity (at higher metallicities the cooling is more effective, the temperature drops, and the excitation diminishes). Since no significant abundance gradient has been found among the SF knots in Tololo 1937-423 (see Sect. 3.3.2), the variations in their excitation is most probably associated with changes in the radiation field.
In the northweast of the galaxy and southweast of knot e we can distinguish two regions that do not coincide with any peak in the SF and where [O iii] λ5007/Hβ also reaches high values. Such high ionization regions, located in the galaxy outskirts or in the periphery of SF knots, are most probably related with the presence of shocks. This is supported by Fig. 14, which shows that shocks are acting on these areas.
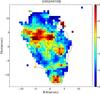 |
Fig. 10 [O iii] λ5007/Hβ emission-line ratio map for Tololo 1937-423 with contours on Hα overplotted. |
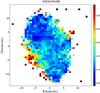 |
Fig. 11 [N ii] λ6584/Hα emission-line ratio map for Tololo 1937-423 with contours on Hα overplotted. |
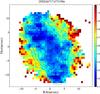 |
Fig. 12 [S ii] λλ6717, 6731/Hα emission-line ratio map for Tololo 1937-423 with contours on Hα overplotted. |
The [N ii] λ6584/Hα and [S ii] λλ6717, 6731/Hα maps of Tololo 1937-423 (Figs. 11 and 12) show basically the same structure. Like the excitation, both maps trace the SF regions, and the minima in [N ii] λ6584/Hα and [S ii] λλ6717, 6731/Hα are associated with the maxima in the excitation, as expected in regions ionized by UV photons coming from massive stars. The line-ratio values are consistent with photoionization from hot stars, except for the outer regions in the [S ii] λλ6717, 6731/Hα map, where large numbers ([S ii] λλ6717, 6731/Hα≥ 0.8) indicate that another ionization mechanism (most probably shocks) must be playing a relevant role.
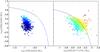 |
Fig. 13 Optical emission-line diagnostic diagram for the different spaxels in Tololo 1937-423. The theoretical “maximum starburst line” derived by Kewley et al. (2001) is also included in the figure. To better visualize the results in the diagram, the points are color-coded according to their distance to the maximum starburst line. In both diagrams, the lower left section of the plot is occupied by spaxels in which the dominant energy source is the radiation from hot stars (blue and green points in the figure). Additional ionizing mechanisms shift the spaxels to the top right and right part of the diagrams (yellow to red colors). |
3.2.4. Diagnostic diagrams
Since the pioneering work of Baldwin et al. (1981), diagnostic-diagrams have been commonly employed to distinguish among the different excitation mechanisms acting in emission-line galaxies (Veilleux & Osterbrock 1987; Kewley et al. 2001, 2006; Kauffmann et al. 2003). The advent of integral field spectrographs working at large telescopes opened new and valuable possibilities in the application of these diagrams. Integral-field high-sensitivity spectroscopy permits building diagnostic diagrams in terms of spaxels, that is, to plot in the diagram each individual element of spatial resolution, and thus to investigate the existence of distinct mechanims acting in different regions of the galaxy. This technique has been applied in recent years with great success to nearby galaxies (Sharp & Bland-Hawthorn 2010; Rich et al. 2011, 2012, 2015; Leslie et al. 2014; Belfiore et al. 2015, 2016; Cairós & González-Pérez 2017).
To investigate the power sources acting in Tololo 1937-423, we plot the values of its emission-line ratios in the diagnostic diagrams of [O iii] λ5007/Hβ versus [N ii] λ6584/Hα and [S ii] λλ6717, 6731/Hα (see Fig. 13). We also draw in the graphics the maximum starburst line or photoionization line derived by Kewley et al. (2001). These authors used the starburst grids from the pegase evolutionary synthesis models (Fioc & Rocca-Volmerange 1997) and the gas ionizing code mappingsiii (Sutherland & Dopita 1993) to parametrize an extreme starburst line, which marks the limit between gas photoionized by hot stars and gas ionized via other mechanisms. Accordingly, the flux ratios of any object lying above this boundary cannot be modeled by hot star photoionization, but require an additional contribution from a harder radiation source such as an AGN or shock excitation. This maximum starburst line is a conservative border, meaning that it provides a lower limit to the amount of shock-ionized gas (Kewley et al. 2001; Kauffmann et al. 2003).
We found for Tololo 1937-423 that a significant number of spaxels fall out of the areas occupied by photoionization by stars in the [O iii] λ5007/Hβ versus [S ii] λλ6717, 6731/Hα diagram. The ratio [N ii] λ6584/Hα, weakly dependent of the hardness of the radiation and strongly dependent on the metallicity, is not effective in separating shocks from photoionized regions. In particular at low metallicities (0.2 Z⊙≤Z≤0.4 Z⊙), the diagrams are degenerated, and shock-ionization and photoionization overlap (Allen et al. 2008; Hong et al. 2013).
Figure 14 shows the spatial location in the galaxy of the points plotted in the [O iii] λ5007/Hβ versus [S ii] λλ6717, 6731/Hα diagnostic diagram. Shocked regions are located mainly in the galaxy outskirsts and in the periphery of the SF regions (inter-knot areas), conforming with the idea of their being generated by mechanical energy driven by stellar feedback. This is consistent with shocks caused by the collective effect of massive stellar winds and SN remnants. The same behavior has been found for the other BCGs studied by means of IFU (Cairós et al. 2015; Cairós & González-Pérez 2017).
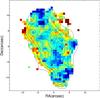 |
Fig. 14 Spatial localization of the spaxels in the diagnostic diagram [O iii] λ5007/Hβ versus [S ii] λλ6717, 6731/Hα. The color-code is the same as in Fig. 13. The redder regions are those situated above the maximum starburst line from Kewley et al. (2001). |
3.3. Integrated spectroscopy
We used the spatial information contained in emission line and continuum maps to delimitate the nine main H ii-regions seen in emission and the central continuum peak. For each of these regions, we generated a high S/N spectrum by adding the spectra of their corresponding spaxels, typically ~10−20. To set the limits of the SF regions we worked in the Hα map, as this line, being the strongest recombination line in the optical, shows the highest S/N and is, by comparison with Hγ and Hβ, not heavily affected by stellar absorption (Olofsson 1995). The nuclear region has been delimited in the continuum frame. Because there is no definitive criterion to set the limits of the regions, we adopted a pragmatic approach and integrated over a boundary that traces the morphology of the cluster, keeping in mind that the minimun size is limited by the seeing.
The integrated spectra of the selected regions differ in their shapes and in the presence and/or strength of several spectral lines. Knots a and b, the two brighter emitters in the central curvilinear feature (see Fig. 7), display both a typical nebular spectrum, with prominent hydrogen recombination lines, [O iii], [N ii] and [S ii] in emission, in addition to a weak continuum, which slightly increases toward the blue wavelengths; small absorption wings are visible around the Balmer lines in emission. To the south, the spectra of knots c, d, and e show higher continua and clear absorption wings around Hγ and Hβ, revealing a major contribution of the underlying stellar population. Knots f, g, h, and i, the small SF regions detected at the filaments, display all prominent emission lines in addition to a weak and featureless continuum. Finally, the spectrum of the nuclear region increases visibly toward blue wavelengths, Hγ and Hβ display strong absorption wings, and absorption lines characteristic of A stars such as CaI λ4226 or MgII λ4482 are clearly visible. The high ionization He II λ4686 Å, typical feature of Wolf-Rayet (WR) stars, is not detected in any knot. Figure 15 shows as an example the integrated spectrum of knots a, e, g, and the nuclear region in the wavelength range where spectral features have been measured.
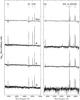 |
Fig. 15 Flux-calibrated spectra of three of the nine selected H ii regions, and the nuclear region in Tololo 1937-423, in logarithmic units. |
3.3.1. Line fluxes and reddening correction
Emission-line fluxes in each integrated spectrum were measured using the task splot within the iraf1 environment. Fluxes were computed by fitting a Gaussian plus a linear function to the line and continuum to all but the higher-order Balmer lines. The higher-order Balmer line fluxes in emission can be considerably affected by the underlying stellar absorption. To take this effect into account, we fit the line profiles with two Gaussian functions in the cases in which the absorption wings are clearly visible – Hβ in all the spectra and Hγ in all but knots g, h, and i. In Hα, where the absence of visible absorption wings makes a reliable decomposition impossible, we assumed the equivalent width in absorption to be equal to that in Hβ. The equivalent width of Hγ and Hβ in absorption in the cases where the fit was made ranges between 2.0 and 5.3 Å (see Table 2), which is in good agreement with the predictions of evolutionary synthesis models (Olofsson 1995; González Delgado et al. 1999).
We derived the interstellar extinction coefficient from the Hα/Hβ ratio (Osterbrock & Ferland 2006). Although Hγ falls also in the observed spectral range, we did not use this line because its flux is considerably affected by the errors in the correction from underlying absorption: the strength of the Balmer-lines series in emission decreases rapidly with decreasing wavelength, whereas the equivalent width of the stellar absorption is roughly constant (Olofsson 1995; González Delgado & Leitherer 1999). For the theoretical value of the Hα/Hβ ratio, we assumed case B approximation, with T = 10 000 K and Ne≤ 100 cm3. The extinction law from O’Donnell (1994) was adopted.
Reddening-corrected line intensity ratios, normalized to Hβ, for the SF knots and the nuclear region in Tololo 1937-423.
Reddening-corrected emission-line fluxes and interstellar extinction coefficients derived for each integrated region are presented in Table 2. Significant variations appear among the interstellar extinction coefficients for the different knots: the highest value is found for the nuclear region [C(Hβ) = 0.76 ± 0.02, E(B−V) = 0.53 ± 0.02], while knot g has the lowest coefficient [C(Hβ) = 0.18 ± 0.05, E(B−V) = 0.13 ± 0.04]. The C(Hβ) value we found for the nuclear region agrees well with the value derived from the integrated spectrum, C(Hβ) = 0.70, by Lagos et al. (2007).
3.3.2. Diagnostic line ratios, physical parameters, and abundances
The values of the diagnostic line ratios, and the derived electron densities (Ne), and the electron temperatures (Te) in the selected regions of Tololo 1937-423 are shown in Table 3.
Diagnostic line ratios, physical parameters and abundances for the SF and the nuclear region in Tololo 1937-423.
Electron densities were derived using the [S ii] λλ6717, 6731 line ratio (Osterbrock & Ferland 2006). Electron temperatures were calculated from [O iii]λ4363/(λ4959 + λ5007) in the knots where [O iii]λ4363 was reliably measured, that is, in knots a and b. Parameters Ne and Te were computed using the five-level atom fivel program in the iraf nebular package (De Robertis et al. 1987; Shaw & Dufour 1995).
The oxygen abundance could not be determined using the direct Te-method, not even in the two knots where [O iii]λ4363 was measured, because this method requires the measurement of the [O ii] λλ3727, 3729 or, alternatively, the [O ii] λλ7320, 7331 lines. [O ii] λλ3727, 3729 falls out of the VIMOS spectral range, and the [O ii] λλ7320, 7331 lines, although within the observed range, fall very close to the edge of the spectrum, in a zone that is highly affected by sky residuals, which prevents obtaining reliable flux values. We therefore estimated the oxygen abundances by adopting the new empirical method introduced by Pilyugin & Grebel (2016); these authors provide a calibration particularly indicated for cases where [O ii] λλ3727, 3729 are not available, the so-called “S calibration”: the oxygen abundance is derived from the intensities of the strong lines [O iii]λλ4957, 5007, [N ii]λλ6548, 6584, and [S ii]λλ6717, 6731.
The values derived for the different regions selected in Tololo 1937-423 are also shown in Table 3. Their relative accuracy is 0.1 dex. For comparison, abundances were also estimated using the [O iii]/[N ii] indicator, as introduced in Pettini & Pagel (2004), a calibration especially suited to be applied at higher redshifts. All regions present similar oxygen abundances, 12 + log(O/H) ~ 8.20 (≈0.3 Z⊙2). The values obtained by applying the Pettini & Pagel (2004) calibration are systematically higher than those obtained from Pilyugin & Grebel (2016), but are consistent within the uncertainties.
3.4. Ionized gas kinematics
We investigated the kinematics of the emitting gas in Tololo 1937-423 from the two brightest emission lines, namely, Hα and [O iii]λ5007. Figure 16 (top panels) presents the Hα and [O iii]λ5007 line-of-sight (LOS) velocity maps measured from the Doppler shift of the line profile centroid relative to the galaxy systemic velocity. The Hα velocity field is more extended than that of the [O iii]λ5007 line because of the better Hα S/N, but both maps exhibit the same large-scale pattern: an overall rotation along an axis oriented southeast-northwest, with the regions situated northeast moving toward us and those placed southwest moving away. The amplitude of the Hα velocity field is ~125 km s-1.
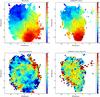 |
Fig. 16 Hα and [O iii]λ5007 line-of-sight velocity fields (at the top) and velocity dispersion maps (at the bottom). |
The LOS velocity dispersion was derived from the width of the Gaussian fit to the line profile after accounting for the instrumental broadening. The Hα and [O iii]λ5007 velocity dispersion maps both show a clear spatial pattern (Fig. 16, bottom panels): relatively low velocity dispersions (10 km s-1≤σ≤ 15 km s-1) are found in the SF regions, whereas the values increase up to 45−50 km s-1 at the northwest and southeast galaxy edges and in the space between the SF knots. Similar patterns have been found in the few other blue compact and dwarf galaxies for which 2D maps of the ionized gas velocity dispersion are available (Bordalo et al. 2009; Moiseev & Lozinskaya 2012; Moiseev et al. 2015; Cairós et al. 2015; Cairós & González-Pérez 2017; Lagos et al. 2016). Moiseev et al. (2015) argued that the ionized gas turbulent motions in dwarfs do not reflect virial motions, but are instead connected with stellar feedback, that is, with the energy injected into the ISM by stellar winds and SN explosions. Numerical simulations yield similar conclusions (Dib et al. 2006).
Applying the commonly used tilted-ring analysis (Rogstad et al. 1974; Begeman 1987, 1989), we can derive the galaxy rotation curve from the observed velocity field. This method assumes that the galaxy velocity field is only due to rotation and that the disk is made of several concentric (not necessarily coplanar) rings, each of them characterized by its rotational velocity, vrot, radius, r, and inclination, i. The LOS velocity field in the plane of the sky is then 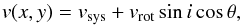 (1)where vsys is the systemic velocity and θ the azimuthal angle from the major axis in the plane of the galaxy. The azimuthal angle is related to the center of the ring (x0,y0), the position angle in the sky (PA) and i as follows:
 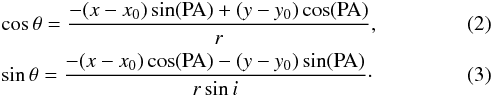 The parameters vrot, i, PA, as well as the position of the center (x0,y0) and vsys are computed through a nonlinear least-squares fit of the observed velocity field to the model (Eq. (1)).
While vrot, i, and PA take different independent values for each ring, (x0,y0) and vsys are common. Generally, these two values are determined iteratively (e.g., Begeman 1989; Elson et al. 2010): all parameters are fit independently for each ring, and after this, the common (x0,y0) and vsys are obtained by averaging over the values of the individual rings. Next, the fit is repeated, but now with (x0,y0) and vsys fixed. However, proceeding in this way, we have detected convergence problems, which are most probably due to some degeneracy between (x0,y0) and vsys, so we employed an alternative method. We found it much more robust to first determine (x0,y0) and vsys independently by applying the following simple symmetry argument: the tilted-ring velocity field (Eqs. (1)–(3)) is (anti) point-symmetric, that is, any two points P and Q at the same distance from the center (x0,y0) but opposite position angles, PA and PA + 180°, have velocities vP,Q = vsys ± Δ and hence, the mean LOS velocity of the pair is vsys. We computed then (vP + vQ) / 2 across the galaxy and define the galaxy center as the position in which the dispersion of the means (vP + vQ) / 2 is minimal, that is, we created an algorithm that finds (x0,y0) and vsys by minimizing 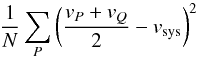 (4)using a least-squares algorithm for all N points P in the galaxy and their point-antisymmetric Q – with respect to (x0,y0) –. The algorithm starts at an initial guess and converges to the center of the velocity field.
The rotation curve of Tololo 1937-423, inferred from the Hα velocity field, is shown in Fig. 17. The curve increases rapidly in the central areas of the galaxy, and flattens at distances ≥ 10′′ (~ 2 kpc) to vrot = 70 ± 7 km s-1. This is calculated from the average of the last three data points. From vrot we can estimate the dynamical mass enclosed in a given radius, r, using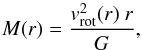 (5)where G is the gravitational constant. Equation (5)assumes a spherical mass distribution, that is, a dark-matter-dominated galaxy. This is a reasonable assumption that takes into account the findings for most studied dwarfs (see, e.g., Carignan & Beaulieu 1989). From here we derived a dynamical mass of M = 2.9 × 10⁹M⊙ for Tololo 1937-423.
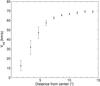 |
Fig. 17 Measured rotation curve of the ionized gas in Tololo 1937-423 from Hα. |
4. Discussion
Hα derived quantities for the individual SF regions identified in Tololo1937-423.
Tololo 1937-423 is currently undergoing an extended SF episode, as revealed by its emission line maps. The ionized gas traces the current SF because only short-lived OB stars are able to produce photons energetic enough to ionize hydrogen. In the Hα emission-line maps we have identified nine main SF knots, aligned northeast-southwest, and stretching to galactocentric distances of up to 2.5 kpc (see Sect. 3.3). Probing their spatial and temporal distribution, that is, examining their morphological pattern and estimating their ages, will give us information on the mechanism(s) that trigger and propagate the recent SF.
Hydrogen recombination lines are used to constrain the properties of H ii-regions, as their flux is proportional to the number of ionizing photons radiated by the central stars. In particular, Hα is an excellent diagnostic line in the nearby Universe: its luminosity is a robust SFR calibrator (Kennicutt 1998) and its equivalent width is very highly sensitive to the starburst age (Leitherer et al. 1999).
Table 4 compiles the Hα fluxes, luminosities, and equivalent widths for selected SF regions in Tololo 1937-423. All knots have Hα luminosities typical of supergiant H ii-regions, but knots close to the galaxy center are brighter than knots located in the filaments. We derived the SFR and the number of ionizing photons (NLyC) from the Hα luminosity following Osterbrock & Ferland (2006) (Cols. 5 and 6 in Table 4).
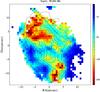 |
Fig. 18 Hα equivalent width map for Tololo 1937-423 with the Hα contours overplotted. |
We estimated the ages of the SF knots by comparing their Hα equivalent widths with the predictions of the Starburst 99 evolutionary synthesis models (Leitherer et al. 1999). Adopting a metallicity z = 0.008 (the value closest to the metallicity derived from the emission-line fluxes), we found that the knot equivalent widths can be reproduced with an instantaneous burst of SF, a Salpeter initial mass function (IMF) with an upper mass limit of 100 M⊙, and ages between 5.0 and 7.1 Myr (last column in Table 4).
It is known, however, that the measured Balmer-line equivalent widths can decrease as a result of A-F stars absorption and/or a high continuum from an older stellar population (Levesque & Leitherer 2013). The Hα measurements in Table 4 are corrected for stellar absorption (see Sect. 3.3.1), but not for an older star continuum. A correction for a higher continuum would require analyzing the spectra in terms of population synthesis, or alternatively, the structural modeling of the underlying population using additional data (e.g., deep broadband imaging), and this is beyond the scope of this work. Thus, the derived ages must be understood as an upper limit. Cairós et al. (2002, 2007) modeled the LSB component of the BCDs Mrk 370 and Mkr 35 and estimated that the falling off in the Hα equivalent width associated with a higher continuum could be as high as a 70% and that this was additionally largely dependent on the spatial position. The uncertainties in the derived ages due to this variations are ~1−1.5 Myr.
Since the Hα equivalent width decreases almost monotonically with starburst age, the Hα equivalent width depicts the age of the SF regions (Fig. 18). Younger knots (i.e., larger equivalent widths) are found at larger galactocentric distances, while older knots (i.e., smaller equivalent widths) lie closer to the continuum peak. This indicates that dilution due to a high continuum is the apparent origin of the gradient in equivalent widths, and consequently, of the derived ages, and it supports the hypothesis that the H ii regions in Tololo 1937-423 depict a simultaneous SF episode, most likely triggered by a large-scale mechanism that was active in the galaxy about 5−7 Myr ago. The nearly constant oxygen abundance found for all the clumps also indicates that all of them belong to the same SF event.
The point symmetric distribution of ionized gas around the continuum peak suggests triggered SF. Large holes and shells are frequently found in the H i and ionized gas distribution of dwarf galaxies (Puche et al. 1992; Staveley-Smith et al. 1997; Walter 1999; Kim et al. 1999). Holes in H i are thought to be created by feedback from massive stars: the supersonic flows generated by distant SN blast waves and/or stellar winds sweep up a shell of shocked neutral gas (Weaver et al. 1977; McCray & Kafatos 1987; Tenorio-Tagle & Bodenheimer 1988; Weisz et al. 2009b,a; Warren et al. 2011; Bagetakos et al. 2011). Evidence is accumulating that in the rims of these bubbles, new (secondary) star formation can occur (Lozinskaya 2002; Cannon et al. 2005; Egorov et al. 2014, 2017; Cairós & González-Pérez 2017). In line with these findings, the ionized gas emission in Tololo 1937-423 could be tracing a secondary SF episode.
To validate the likelihood of a scenario of propagated SF, we have to find the remmant of the OB association whose massive stars caused the blast wave. Then, we must proof that both SF events, the current and the previous SF episode, could indeed be causally related.
The obvious progenitor candidate in Tololo 1937-423 is the stellar cluster (or clusters) that generates the continuum peak. Broadband surface photometry shows an apparent color gradient in the galaxy (Doublier et al. 1999; Gil de Paz & Madore 2005). Gil de Paz & Madore (2005) derived a color (B−R) = 1.21 ± 0.11 for the LSB underlying host, indicative of ages of several Gyr (Vazdekis et al. 1996), whereas from their color profile we infer (B−R)~ 0.8 at the galaxy center. We showed in Sect. 3.2.1 that the interstellar extinction also peaks in this region, which means that the actual (B−R) is indeed even bluer. This color gradient is most probably evidence of an age gradient. Moreover, the strong absorption in Hβ and Hγ in the nuclear spectrum (see Sect. 3.3 and Fig. 15) reveals the presence of A-F intermediate-age stars. The value of the equivalent width in absorption of higher-order Balmer lines has been shown to effectively constrain the age of a poststarburst (Olofsson 1995; González Delgado & Leitherer 1999; González Delgado et al. 1999). By comparing Hγ and Hβ equivalent widths in absorption with the predictions of the synthesis models by González Delgado et al. (1999), we estimated the ages for the nuclear region of ~13 and 20 Myr, assuming an instantaneous burst (IB) and solar metallicity (Z⊙) and 0.05 Z⊙, respectively. Since we are integrating over a region of diameter ~600 pc that probably contains several stellar clusters, the IB aproximation is likely too simplistic and the derived ages are lower limits. Using the model predictions for a continuous SF burst, we obtained older ages of ~40−80 Myr.
We found that the stellar population in the central region of the galaxy is several tens of Myr old (13−80 Myr), while the more extended and recent SF episode is ~5−7 Myr old. These ages, together with the distance between the different SF episodes, imply velocities of 20 to 100 km s-1 for the blast wave caused by the SN explosions from the central post-starburst, to be able to ignite the current SF, in good agreement with the expansion velocities found for shells in dwarf galaxies (Walter 1999; Egorov et al. 2014, 2017). Hence, the morphology and age distribution of the SF episode both indicate triggered SF in Tololo 1937-423, with the most recent SF episode triggered by the collective effects of stellar winds and SN explosions from the central post-starburst.
Other observables also favor triggered SF in Tololo 1937-423. The ionized gas morphology, with filaments and curvilinear structures, is characteristic of an ISM perturbed by the action of stellar winds and SN explosions. The velocity dispersion pattern, with turbulent motions increasing toward the periphery of the SF regions and at the galaxy edges, can be naturally explained if these high dispersions are due to the mechanical energy injected into the gas by stellar feedback. The presence of shocked regions in the galaxy also conforms to triggered SF, since the most viable mechanism to drive shocks in star-forming galaxies are SN explosions and massive stellar winds (Shull & McKee 1979; Allen 1999).
Recent Hubble Space Telescope analyses of resolved stellar populations on nearby dwarf galaxies have shown that the starburst episodes in these galaxies are indeed much longer than previously thought, lasting up to ~200−400 Myr (McQuinn et al. 2009, 2010a,b). Feedback from massive stars in dwarfs and, more specifically, new SF triggered by the cumulative effects of stellar winds and SN explosions, would naturally explain such temporally extended starbursts.
5. Summary
We presented results from a broad analysis of the BCG Tololo 1937-423 based on integral field observations. We mapped the central 5.4 × 5.4 kpc2 of the galaxy in the 4150–7400 Å spectral range with a spatial resolution of ~133 pc using VIMOS at the VLT, and probed its morphology, stellar content, nebular ionization and excitation properties, as well as the kinematics of its ionized gas. Our main conclusions are the following.
-
The SF in Tololo 1937-423 is spatially extended.The current SF episode is taking place in variousknots, which reach galactocentric distances of up to2.5 kpc. The brighter SF clumps areclose to the center of the galaxy, while fainter clumps are located infilaments stretching northeast and southwest. We delimited ninemain SF regions in the galaxy and produced theirintegrated spectrum, from which reliable physical parametersand oxygen abundances were computed. We found that allclumps present similar abundances (12 +log(O/H) = 8.20 ± 0.1); we did not find significant variations on scales of kpc.
-
Tololo 1937-423 displays distinct patterns in their emission line and continuum maps. While emission line maps are extended and knotty, the continuum map has a single peak, situated roughly at the galaxy center, which does not spatially coincide with any clump in emission lines. This implies at least two relatively recent SF episodes. Using evolutionary synthesis models, we estimate ages of ~5−7 Myr for the ongoing starburst, whereas the stellar population in the central region of the galaxy is found to be tens of Myr old (13−80 Myr).
-
The galaxy shows an inhomogeneous dust distribution, with the extinction peak reached roughly at the position of the continuum peak. Here, the color excess is E(B−V)~ 0.71.
-
Although photoionization by hot stars is the dominant excitation and ionization mechanism in the galaxy, shocks are playing a major role in the galaxy outer regions and in the periphery of the SF regions (inter-knot areas).
-
The LOS ionized gas velocity field of Tololo 1937-423 displays ordered motions, with an overall rotation around an axis oriented SE-NW. The amplitude of the Hα velocity field is ~125 km s-1. The rotation curve, inferred from the Hα velocity field, increases rapidly in the central areas of the galaxy and flattens at distances ≥ 10′′ (~ 2 kpc) to a value Vrot = 70 ± 7 km s-1. Assuming that the galaxy is dark matter dominated, we derived a dynamical mass M = 2.9 × 10⁹M⊙.
-
The LOS velocity dispersion maps of Tololo 1937-423 show relatively low velocity dispersions (10 km s-1≤σ≤ 15 km s-1) in the SF regions, and values that increase up to 45−50 km s-1 at the northwest and southeast galaxy edges and in the space between the SF knots.
-
The morphology of the galaxy and the two distinct SF episodes suggest a scenario of triggered SF. Ages derived for the different SF episodes, ~13−80 Myr for the central post-starburst and 5−7 Myr for the ongoing SF, are consistent with star-induced SF, with the most recent SF episode caused by the collective effect of stellar winds and SN explosions from the central post-starburst. The velocity dispersion pattern (higher velocity dispersions at the edges of the SF regions) and the shocked regions in the galaxy also support this scenario.
IRAF (Image Reduction and Analysis Facility) is a software system for the reduction and analysis of astronomical data. It is distributed by the NOAO, which is operated by the Association of Universities for Research in Astronomy, Inc., under cooperative agreement with the National Science Foundation.
Solar abundances: 12 + log(O/H) = 8.69 (Asplund et al. 2009).
Acknowledgments
L.M.C. acknowledges support from the Deutsche Forschungsgemeinschaft (CA 1243/1-1). The authors are very grateful to N. Caon and P. Weilbacher, members of the IFU-BCG project. We also thank R. Manso-Sainz and Oliver Mettin for many constructive discussions. Further thanks go to R. Mettin for a careful reading of the manuscript. This research has made use of the NASA/IPAC Extragalactic Database (NED), which is operated by the Jet Propulsion Laboratory, Caltech, under contract with the National Aeronautics and Space Administration.
References
- Allen, M. G., Groves, B. A., Dopita, M. A., Sutherland, R. S., & Kewley, L. J. 2008, ApJS, 178, 20 [Google Scholar]
- Allen, M. L. 1999, Ph.D. Thesis, University of Toronto (Canada) [Google Scholar]
- Aller, L. H. 1984, Physics of thermal gaseous nebulae, Astrophys. Space Sci. Lib., 112 [Google Scholar]
- Asplund, M., Grevesse, N., Sauval, A. J., & Scott, P. 2009, ARA&A, 47, 481 [NASA ADS] [CrossRef] [Google Scholar]
- Bagetakos, I., Brinks, E., Walter, F., et al. 2011, AJ, 141, 23 [NASA ADS] [CrossRef] [Google Scholar]
- Baldwin, J. A., Phillips, M. M., & Terlevich, R. 1981, PASP, 93, 5 [NASA ADS] [CrossRef] [EDP Sciences] [Google Scholar]
- Barkana, R., & Loeb, A. 1999, ApJ, 523, 54 [NASA ADS] [CrossRef] [Google Scholar]
- Begeman, K. G. 1987, Ph.D. Thesis, Kapteyn Institute [Google Scholar]
- Begeman, K. G. 1989, A&A, 223, 47 [NASA ADS] [Google Scholar]
- Belfiore, F., Maiolino, R., Bundy, K., et al. 2015, MNRAS, 449, 867 [NASA ADS] [CrossRef] [Google Scholar]
- Belfiore, F., Maiolino, R., Maraston, C., et al. 2016, MNRAS, 461, 3111 [Google Scholar]
- Bordalo, V., Plana, H., & Telles, E. 2009, ApJ, 696, 1668 [NASA ADS] [CrossRef] [Google Scholar]
- Cairós, L. M., & González-Pérez, J. N. 2017, A&A, 600, A125 [NASA ADS] [CrossRef] [EDP Sciences] [Google Scholar]
- Cairós, L. M., Caon, N., Vílchez, J. M., González-Pérez, J. N., & Muñoz-Tuñón, C. 2001, ApJS, 136, 393 [NASA ADS] [CrossRef] [Google Scholar]
- Cairós, L. M., Caon, N., García-Lorenzo, B., Vílchez, J. M., & Muñoz-Tuñón, C. 2002, ApJ, 577, 164 [NASA ADS] [CrossRef] [Google Scholar]
- Cairós, L. M., Caon, N., García-Lorenzo, B., et al. 2007, ApJ, 669, 251 [NASA ADS] [CrossRef] [Google Scholar]
- Cairós, L. M., Caon, N., Papaderos, P., et al. 2009a, ApJ, 707, 1676 [NASA ADS] [CrossRef] [Google Scholar]
- Cairós, L. M., Caon, N., Zurita, C., et al. 2009b, A&A, 507, 1291 [NASA ADS] [CrossRef] [EDP Sciences] [Google Scholar]
- Cairós, L. M., Caon, N., Zurita, C., et al. 2010, A&A, 520, A90 [NASA ADS] [CrossRef] [EDP Sciences] [Google Scholar]
- Cairós, L. M., Caon, N., García Lorenzo, B., et al. 2012, A&A, 547, A24 [NASA ADS] [CrossRef] [EDP Sciences] [Google Scholar]
- Cairós, L. M., Caon, N., & Weilbacher, P. M. 2015, A&A, 577, A21 [NASA ADS] [CrossRef] [EDP Sciences] [Google Scholar]
- Cannon, J. M., Walter, F., Bendo, G. J., et al. 2005, ApJ, 630, L37 [NASA ADS] [CrossRef] [Google Scholar]
- Carignan, C., & Beaulieu, S. 1989, ApJ, 347, 760 [NASA ADS] [CrossRef] [Google Scholar]
- De Robertis, M. M., Dufour, R. J., & Hunt, R. W. 1987, J. Roy. Astron. Soc. Can., 81, 195 [Google Scholar]
- Dekel, A., & Silk, J. 1986, ApJ, 303, 39 [NASA ADS] [CrossRef] [Google Scholar]
- Dekel, A., & Woo, J. 2003, MNRAS, 344, 1131 [NASA ADS] [CrossRef] [Google Scholar]
- Dib, S., Bell, E., & Burkert, A. 2006, ApJ, 638, 797 [NASA ADS] [CrossRef] [Google Scholar]
- Dopita, M. A., & Sutherland, R. S. 2003, Astrophysics of the diffuse universe (Berlin, New York: Springer) [Google Scholar]
- Doublier, V., Caulet, A., & Comte, G. 1999, A&AS, 138, 213 [NASA ADS] [CrossRef] [EDP Sciences] [Google Scholar]
- Egorov, O. V., Lozinskaya, T. A., Moiseev, A. V., & Smirnov-Pinchukov, G. V. 2014, MNRAS, 444, 376 [NASA ADS] [CrossRef] [Google Scholar]
- Egorov, O. V., Lozinskaya, T. A., Moiseev, A. V., & Shchekinov, Y. A. 2017, MNRAS, 464, 1833 [NASA ADS] [CrossRef] [Google Scholar]
- Elson, E. C., de Blok, W. J. G., & Kraan-Korteweg, R. C. 2010, MNRAS, 404, 2061 [NASA ADS] [Google Scholar]
- Fanelli, M. N., O’Connell, R. W., & Thuan, T. X. 1988, ApJ, 334, 665 [NASA ADS] [CrossRef] [Google Scholar]
- Fioc, M., & Rocca-Volmerange, B. 1997, A&A, 326, 950 [NASA ADS] [Google Scholar]
- Gil de Paz, A., & Madore, B. F. 2005, ApJS, 156, 345 [NASA ADS] [CrossRef] [EDP Sciences] [Google Scholar]
- Gil de Paz, A., Madore, B. F., & Pevunova, O. 2003, ApJS, 147, 29 [NASA ADS] [CrossRef] [Google Scholar]
- González Delgado, R. M., & Leitherer, C. 1999, ApJS, 125, 479 [NASA ADS] [CrossRef] [Google Scholar]
- González Delgado, R. M., Leitherer, C., & Heckman, T. M. 1999, ApJS, 125, 489 [NASA ADS] [CrossRef] [Google Scholar]
- Hong, S., Calzetti, D., Gallagher, III, J. S., et al. 2013, ApJ, 777, 63 [NASA ADS] [CrossRef] [Google Scholar]
- Hunter, D. 1997, PASP, 109, 937 [NASA ADS] [CrossRef] [Google Scholar]
- Hunter, D. A., & Elmegreen, B. G. 2004, AJ, 128, 2170 [NASA ADS] [CrossRef] [Google Scholar]
- James, B. L., Tsamis, Y. G., Walsh, J. R., Barlow, M. J., & Westmoquette, M. S. 2013, MNRAS, 430, 2097 [NASA ADS] [CrossRef] [Google Scholar]
- Kauffmann, G., Heckman, T. M., Tremonti, C., et al. 2003, MNRAS, 346, 1055 [Google Scholar]
- Kehrig, C., Telles, E., & Cuisinier, F. 2004, AJ, 128, 1141 [NASA ADS] [CrossRef] [Google Scholar]
- Kennicutt, Jr., R. C. 1998, ARA&A, 36, 189 [Google Scholar]
- Kewley, L. J., Dopita, M. A., Sutherland, R. S., Heisler, C. A., & Trevena, J. 2001, ApJ, 556, 121 [Google Scholar]
- Kewley, L. J., Groves, B., Kauffmann, G., & Heckman, T. 2006, MNRAS, 372, 961 [NASA ADS] [CrossRef] [Google Scholar]
- Kim, S., Dopita, M. A., Staveley-Smith, L., & Bessell, M. S. 1999, AJ, 118, 2797 [NASA ADS] [CrossRef] [Google Scholar]
- Lagos, P., Telles, E., & Melnick, J. 2007, A&A, 476, 89 [NASA ADS] [CrossRef] [EDP Sciences] [Google Scholar]
- Lagos, P., Telles, E., Muñoz-Tuñón, C., et al. 2009, AJ, 137, 5068 [NASA ADS] [CrossRef] [Google Scholar]
- Lagos, P., Demarco, R., Papaderos, P., et al. 2016, MNRAS, 456, 1549 [NASA ADS] [CrossRef] [Google Scholar]
- Larson, R. B. 1974, MNRAS, 169, 229 [NASA ADS] [CrossRef] [Google Scholar]
- Le Fèvre, O., Saisse, M., Mancini, D., et al. 2003, in Instrument Design and Performance for Optical/Infrared Ground-based Telescopes, eds. M. Iye, & A. F. M. Moorwood, Proc. SPIE, 4841, 1670 [Google Scholar]
- Leitherer, C., Schaerer, D., Goldader, J. D., et al. 1999, ApJS, 123, 3 [NASA ADS] [CrossRef] [Google Scholar]
- Leslie, S. K., Rich, J. A., Kewley, L. J., & Dopita, M. A. 2014, MNRAS, 444, 1842 [NASA ADS] [CrossRef] [Google Scholar]
- Levesque, E. M., & Leitherer, C. 2013, ApJ, 779, 170 [NASA ADS] [CrossRef] [Google Scholar]
- Lozinskaya, T. A. 2002, Astronomical and Astrophysical Transactions, 21, 223 [NASA ADS] [CrossRef] [Google Scholar]
- Mac Low, M.-M., & Ferrara, A. 1999, ApJ, 513, 142 [NASA ADS] [CrossRef] [Google Scholar]
- McCall, M. L., Rybski, P. M., & Shields, G. A. 1985, ApJS, 57, 1 [NASA ADS] [CrossRef] [Google Scholar]
- McCray, R., & Kafatos, M. 1987, ApJ, 317, 190 [NASA ADS] [CrossRef] [Google Scholar]
- McQuinn, K. B. W., Skillman, E. D., Cannon, J. M., et al. 2009, ApJ, 695, 561 [NASA ADS] [CrossRef] [Google Scholar]
- McQuinn, K. B. W., Skillman, E. D., Cannon, J. M., et al. 2010a, ApJ, 721, 297 [NASA ADS] [CrossRef] [Google Scholar]
- McQuinn, K. B. W., Skillman, E. D., Cannon, J. M., et al. 2010b, ApJ, 724, 49 [NASA ADS] [CrossRef] [Google Scholar]
- Moiseev, A. V., & Lozinskaya, T. A. 2012, MNRAS, 423, 1831 [NASA ADS] [CrossRef] [Google Scholar]
- Moiseev, A. V., Tikhonov, A. V., & Klypin, A. 2015, MNRAS, 449, 3568 [NASA ADS] [CrossRef] [Google Scholar]
- O’Donnell, J. E. 1994, ApJ, 422, 158 [NASA ADS] [CrossRef] [Google Scholar]
- Olofsson, K. 1995, A&AS, 111, 57 [NASA ADS] [Google Scholar]
- Osterbrock, D. E., & Ferland, G. J. 2006, Astrophysics of gaseous nebulae and active galactic nuclei, 2nd. edn. (Sausalito, CA: University Science Books) [Google Scholar]
- Pettini, M., & Pagel, B. E. J. 2004, MNRAS, 348, L59 [NASA ADS] [CrossRef] [Google Scholar]
- Pilyugin, L. S., & Grebel, E. K. 2016, MNRAS, 457, 3678 [NASA ADS] [CrossRef] [Google Scholar]
- Puche, D., Westpfahl, D., Brinks, E., & Roy, J.-R. 1992, AJ, 103, 1841 [NASA ADS] [CrossRef] [Google Scholar]
- Rich, J. A., Kewley, L. J., & Dopita, M. A. 2011, ApJ, 734, 87 [NASA ADS] [CrossRef] [Google Scholar]
- Rich, J. A., Torrey, P., Kewley, L. J., Dopita, M. A., & Rupke, D. S. N. 2012, ApJ, 753, 5 [NASA ADS] [CrossRef] [Google Scholar]
- Rich, J. A., Kewley, L. J., & Dopita, M. A. 2015, ApJS, 221, 28 [NASA ADS] [CrossRef] [Google Scholar]
- Rogstad, D. H., Lockhart, I. A., & Wright, M. C. H. 1974, ApJ, 193, 309 [NASA ADS] [CrossRef] [Google Scholar]
- Sharp, R. G., & Bland-Hawthorn, J. 2010, ApJ, 711, 818 [NASA ADS] [CrossRef] [Google Scholar]
- Shaw, R. A., & Dufour, R. J. 1995, PASP, 107, 896 [NASA ADS] [CrossRef] [Google Scholar]
- Shull, J. M., & McKee, C. F. 1979, ApJ, 227, 131 [NASA ADS] [CrossRef] [Google Scholar]
- Staveley-Smith, L., Sault, R. J., Hatzidimitriou, D., Kesteven, M. J., & McConnell, D. 1997, MNRAS, 289, 225 [NASA ADS] [CrossRef] [Google Scholar]
- Sutherland, R. S., & Dopita, M. A. 1993, ApJS, 88, 253 [NASA ADS] [CrossRef] [Google Scholar]
- Tenorio-Tagle, G., & Bodenheimer, P. 1988, ARA&A, 26, 145 [NASA ADS] [CrossRef] [Google Scholar]
- Terlevich, R., Melnick, J., Masegosa, J., Moles, M., & Copetti, M. V. F. 1991, A&AS, 91, 285 [NASA ADS] [Google Scholar]
- Thuan, T. X., & Martin, G. E. 1981, ApJ, 247, 823 [NASA ADS] [CrossRef] [Google Scholar]
- Vazdekis, A., Casuso, E., Peletier, R. F., & Beckman, J. E. 1996, ApJS, 106, 307 [NASA ADS] [CrossRef] [Google Scholar]
- Veilleux, S., & Osterbrock, D. E. 1987, ApJS, 63, 295 [NASA ADS] [CrossRef] [Google Scholar]
- Walter, F. 1999, PASA, 16, 106 [NASA ADS] [CrossRef] [Google Scholar]
- Warren, S. R., Weisz, D. R., Skillman, E. D., et al. 2011, ApJ, 738, 10 [NASA ADS] [CrossRef] [Google Scholar]
- Weaver, R., McCray, R., Castor, J., Shapiro, P., & Moore, R. 1977, ApJ, 218, 377 [NASA ADS] [CrossRef] [Google Scholar]
- Weisz, D. R., Skillman, E. D., Cannon, J. M., et al. 2009a, ApJ, 704, 1538 [NASA ADS] [CrossRef] [Google Scholar]
- Weisz, D. R., Skillman, E. D., Cannon, J. M., et al. 2009b, ApJ, 691, L59 [NASA ADS] [CrossRef] [Google Scholar]
- Westera, P., Cuisinier, F., Telles, E., & Kehrig, C. 2004, A&A, 423, 133 [NASA ADS] [CrossRef] [EDP Sciences] [Google Scholar]
All Tables
Reddening-corrected line intensity ratios, normalized to Hβ, for the SF knots and the nuclear region in Tololo 1937-423.
Diagnostic line ratios, physical parameters and abundances for the SF and the nuclear region in Tololo 1937-423.
Hα derived quantities for the individual SF regions identified in Tololo1937-423.
All Figures
|
Fig. 1 B-band image of Tololo 1937-423. The FoV is 1 arcmin; the 27″×27″ VIMOS FoV is overplotted. North is up and east to the left. The image, retrieved from NED, has been published by Gil de Paz et al. (2003). |
| In the text | |
|
Fig. 2 Tololo 1937-423 continuum map constructed by summing over the whole orange spectral range, but masking the emission lines. Contours in Hα flux are overplotted. The image is scaled in arbitrary flux units. The FoV is ~5.4 × 5.4 kpc2, with a spatial resolution of about 133 pc per spaxel; north is up and east to the left, also in all the maps shown from here on. |
| In the text | |
|
Fig. 3 Hα emission line flux map for Tololo 1937-423 in logarithmic scale (flux units are 10-18 erg s-1 cm-2). The cross indicates the position of the continuum peak. |
| In the text | |
|
Fig. 4 [O iii]λ5007 emission line flux map for Tololo 1937-423. |
| In the text | |
|
Fig. 5 [N ii]λ6584 emission line flux map for Tololo 1937-423. |
| In the text | |
|
Fig. 6 [S ii]λλ6717, 6731 emission line flux map for Tololo 1937-423. |
| In the text | |
|
Fig. 7 Contour map of the Hα emission in Tololo 1937-423, with the main SF regions labeled. |
| In the text | |
|
Fig. 8 Hα/Hβ ratio map for Tololo 1937-423 with the contours of the Hα flux map overplotted. |
| In the text | |
|
Fig. 9 Tololo 1937-423 electron density sensitive [S ii] λ6717/ [S ii] λ6731 emission-line ratio with the Hα contour overplotted. |
| In the text | |
|
Fig. 10 [O iii] λ5007/Hβ emission-line ratio map for Tololo 1937-423 with contours on Hα overplotted. |
| In the text | |
|
Fig. 11 [N ii] λ6584/Hα emission-line ratio map for Tololo 1937-423 with contours on Hα overplotted. |
| In the text | |
|
Fig. 12 [S ii] λλ6717, 6731/Hα emission-line ratio map for Tololo 1937-423 with contours on Hα overplotted. |
| In the text | |
|
Fig. 13 Optical emission-line diagnostic diagram for the different spaxels in Tololo 1937-423. The theoretical “maximum starburst line” derived by Kewley et al. (2001) is also included in the figure. To better visualize the results in the diagram, the points are color-coded according to their distance to the maximum starburst line. In both diagrams, the lower left section of the plot is occupied by spaxels in which the dominant energy source is the radiation from hot stars (blue and green points in the figure). Additional ionizing mechanisms shift the spaxels to the top right and right part of the diagrams (yellow to red colors). |
| In the text | |
|
Fig. 14 Spatial localization of the spaxels in the diagnostic diagram [O iii] λ5007/Hβ versus [S ii] λλ6717, 6731/Hα. The color-code is the same as in Fig. 13. The redder regions are those situated above the maximum starburst line from Kewley et al. (2001). |
| In the text | |
|
Fig. 15 Flux-calibrated spectra of three of the nine selected H ii regions, and the nuclear region in Tololo 1937-423, in logarithmic units. |
| In the text | |
|
Fig. 16 Hα and [O iii]λ5007 line-of-sight velocity fields (at the top) and velocity dispersion maps (at the bottom). |
| In the text | |
|
Fig. 17 Measured rotation curve of the ionized gas in Tololo 1937-423 from Hα. |
| In the text | |
|
Fig. 18 Hα equivalent width map for Tololo 1937-423 with the Hα contours overplotted. |
| In the text | |
Current usage metrics show cumulative count of Article Views (full-text article views including HTML views, PDF and ePub downloads, according to the available data) and Abstracts Views on Vision4Press platform.
Data correspond to usage on the plateform after 2015. The current usage metrics is available 48-96 hours after online publication and is updated daily on week days.
Initial download of the metrics may take a while.