Fig. 2
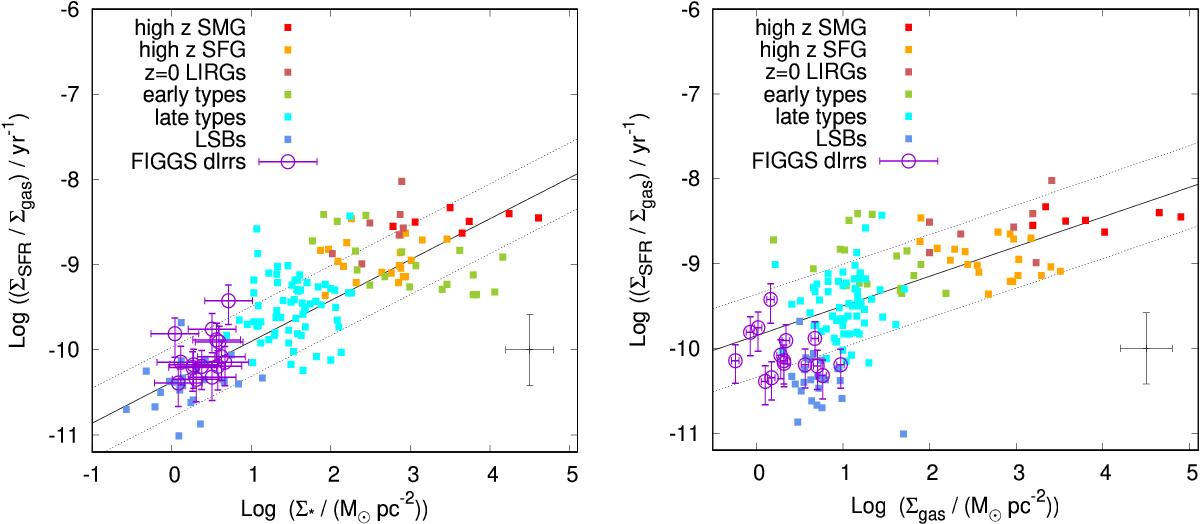
Left panel: star formation efficiency as a function of stellar mass surface density. The different classes of galaxies from S11 are represented by differently coloured filled squares. The typical errorbars for S11 data points are represented by the black error bars. FIGGS galaxies are represented by violet circles with errorbars. The solid and dotted lies are the best fit and 1σ scatter around the best fit from S11. Right panel: star formation efficiency as a function of gas surface density. All symbols are the same as in left panel. The solid and dotted lies are the best fit and 1σ scatter around the best fit from S11 which excludes early types and LSBs.
Current usage metrics show cumulative count of Article Views (full-text article views including HTML views, PDF and ePub downloads, according to the available data) and Abstracts Views on Vision4Press platform.
Data correspond to usage on the plateform after 2015. The current usage metrics is available 48-96 hours after online publication and is updated daily on week days.
Initial download of the metrics may take a while.