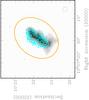
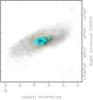
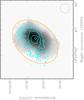
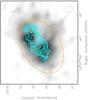
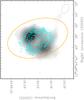
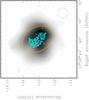
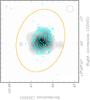
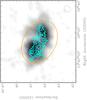
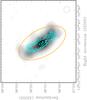
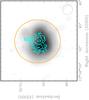
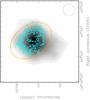
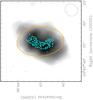
Fig. 1
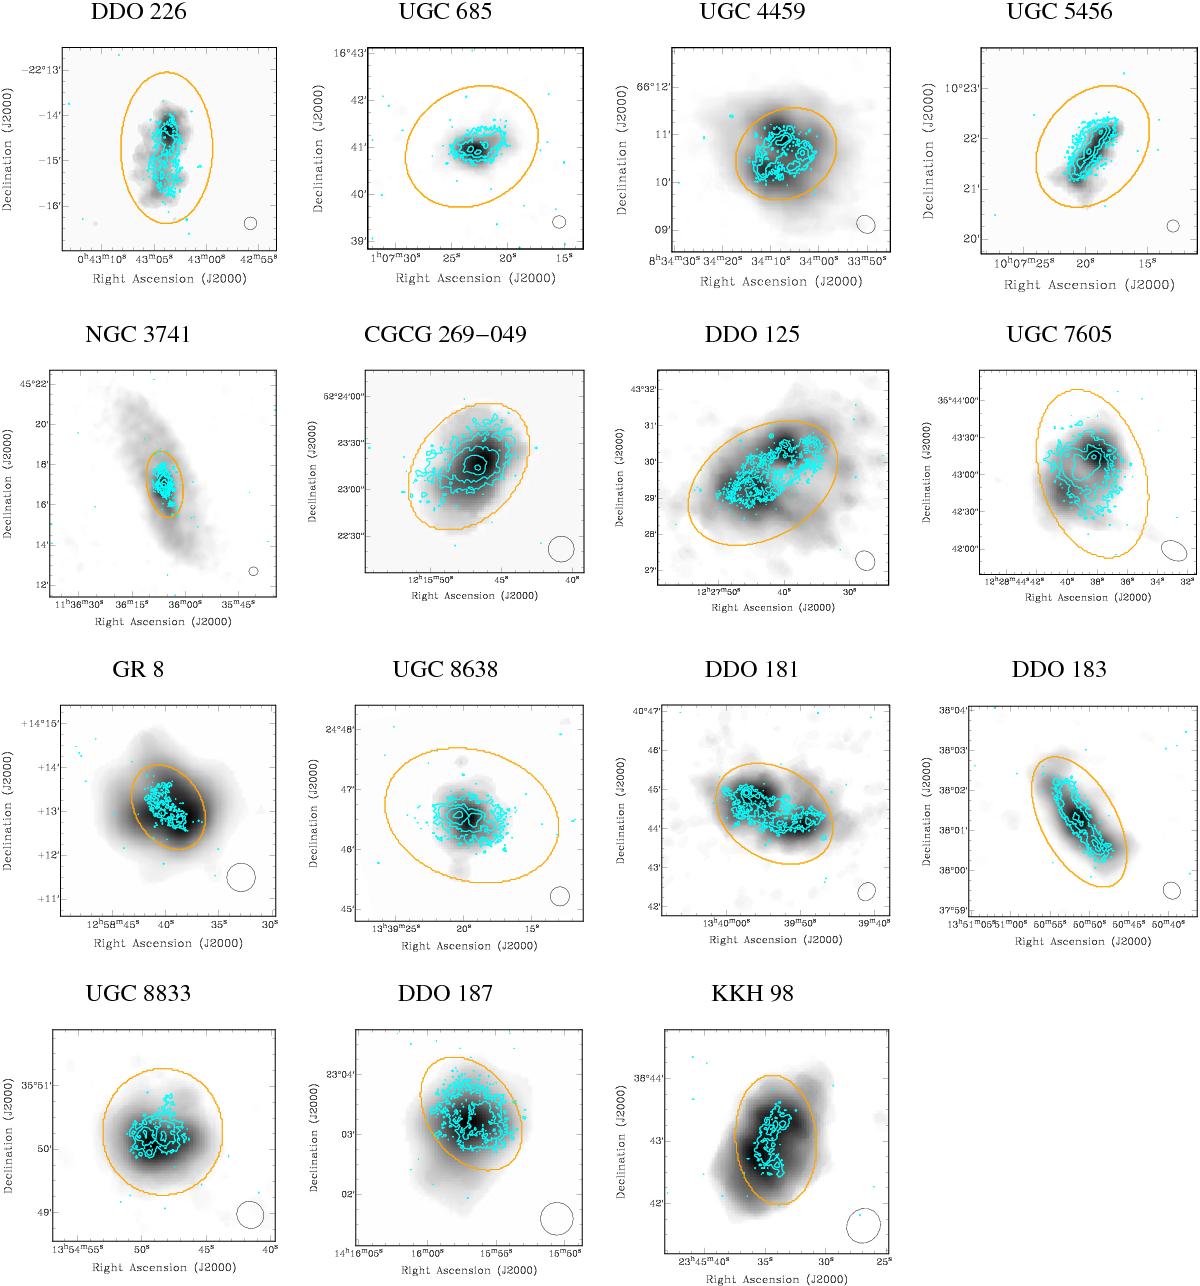
Visual comparison of the extents of HI and star-formation vis-a-vis the stellar disc. FUV flux contours in cyan overlayed on HI column density in greyscale for sample galaxies. The ellipse over which 3.6 μm flux is extracted in Dale et al. (2009) is shown in orange. For the FUV emission the level of the first contour is arbitrarily chosen so that traces of background emission are present, and subsequent contours are in multiples of 4. The HI beams are shown at the bottom right corner of each panel.
Current usage metrics show cumulative count of Article Views (full-text article views including HTML views, PDF and ePub downloads, according to the available data) and Abstracts Views on Vision4Press platform.
Data correspond to usage on the plateform after 2015. The current usage metrics is available 48-96 hours after online publication and is updated daily on week days.
Initial download of the metrics may take a while.