Fig. 1
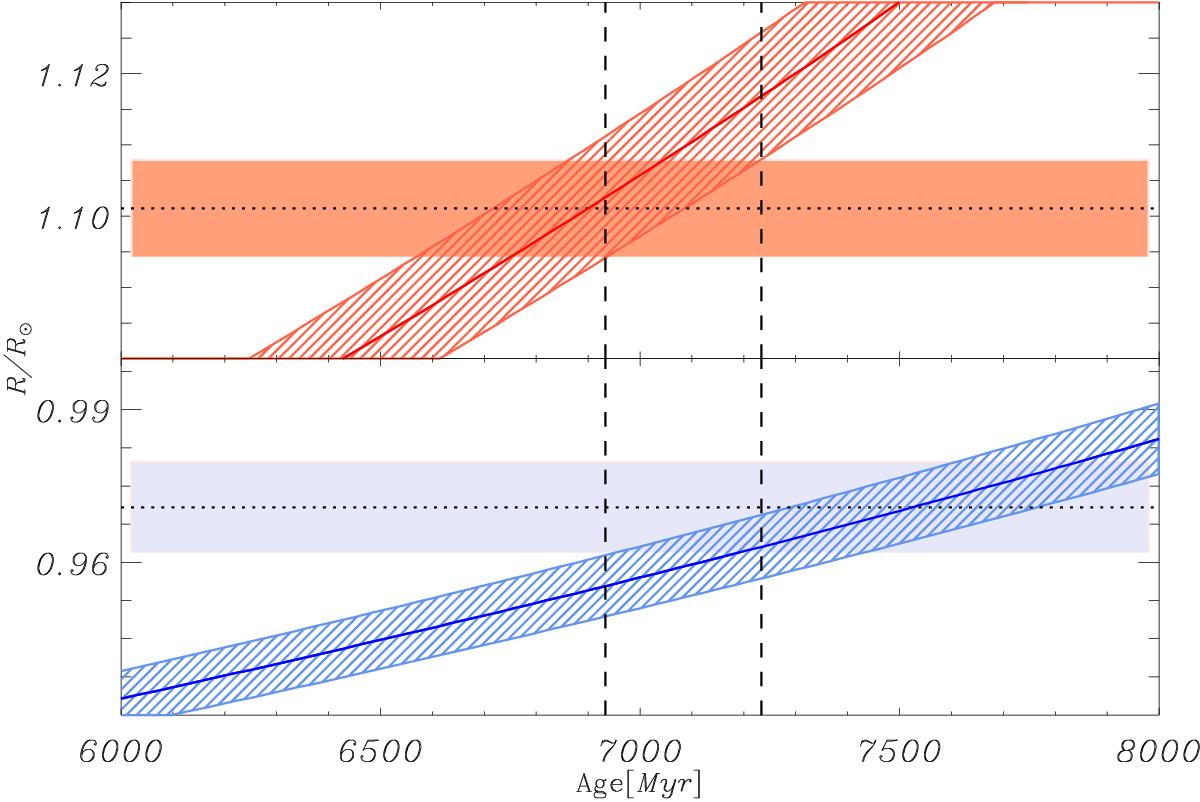
Model evolution of V565 Lyr. Horizontal areas with dashed central lines represent the observed error ranges. The solid line represents the evolution with the mean observed mass and the areas around it represent the 1σ mass range (see Table 1). The two panels show the radius evolution of the primary (top) and secondary (bottom) for V565 Lyr with [Fe/H] i = 0.40, Yi = 0.32. The models include diffusion. Within the errors a common age of 7.08 ± 0.15 Gyr is found (vertical lines).
Current usage metrics show cumulative count of Article Views (full-text article views including HTML views, PDF and ePub downloads, according to the available data) and Abstracts Views on Vision4Press platform.
Data correspond to usage on the plateform after 2015. The current usage metrics is available 48-96 hours after online publication and is updated daily on week days.
Initial download of the metrics may take a while.