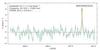
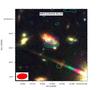
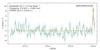
Fig. A.1
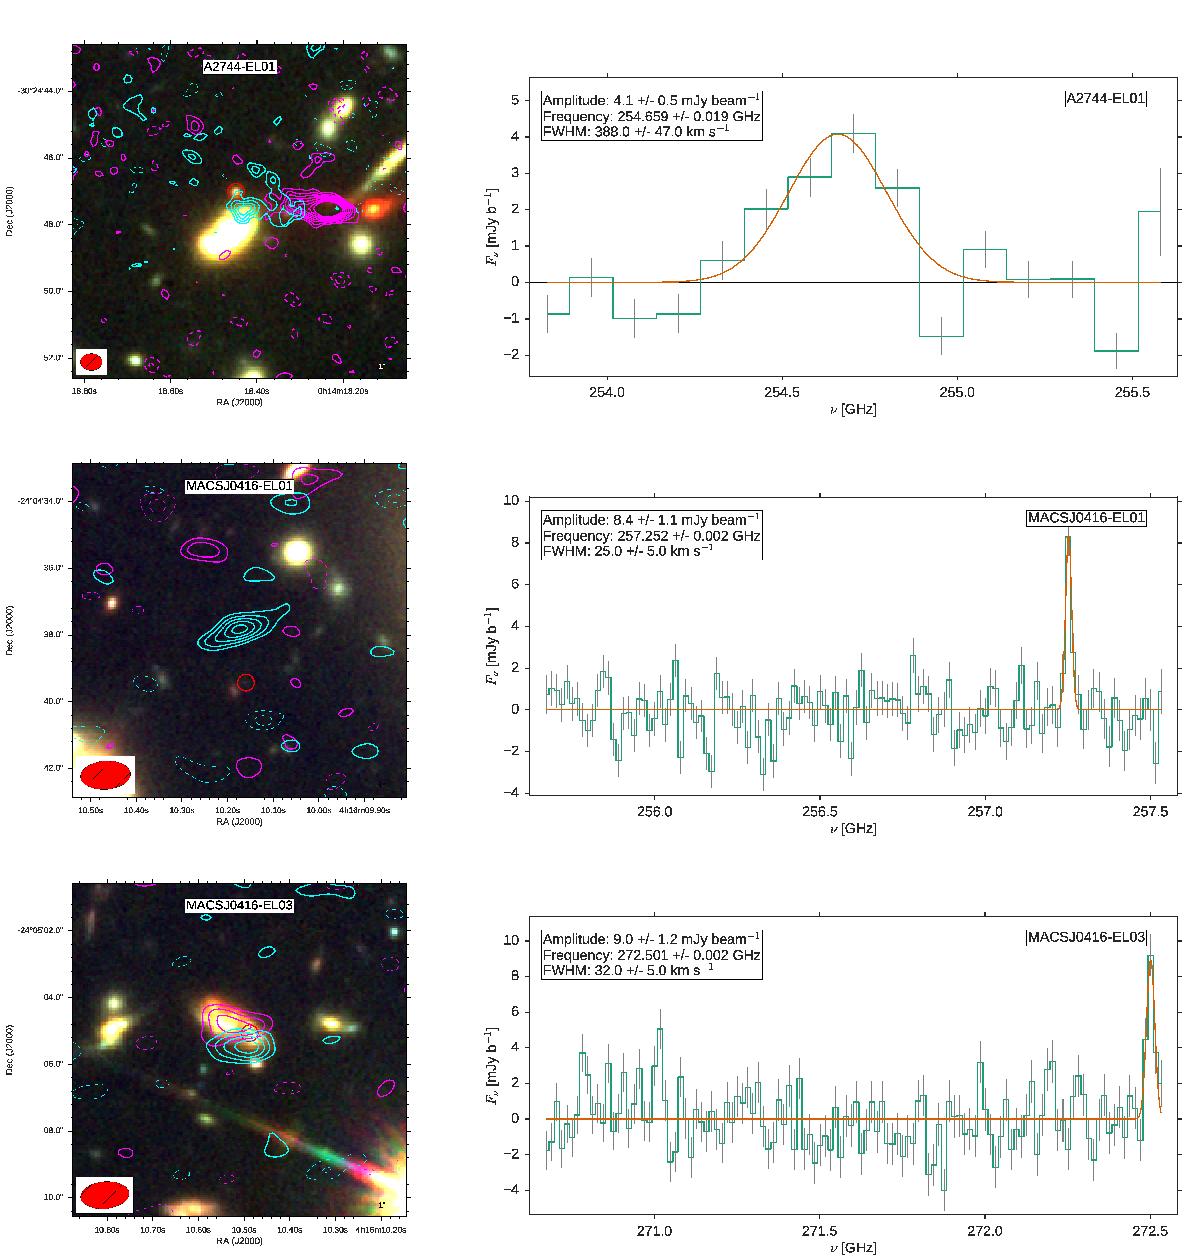
Reliable candidates. Left: HST color image cutouts for the ALMA-FFs emission line candidates. Here bands F435W + F060W correspond to blue, F810W + F105W to green, and F125W + F140W + F160W to red. The cyan contours correspond to S/N levels of the ALMA emission line candidates in 1σ steps starting at ± 2 times the primary beam corrected noise level at the position of the source. The continuum 1.1 mm emission is plotted in magenta in steps from ±2σ up to 9σ. In the bottom left corner, we show the ALMA synthesized beam. The red circle in each left-hand panel marks the position of the nearest galaxy used to estimate Psep. Right: spectra of the emission line candidates. We plot the observed spectrum extracted in the peak for each line in green with 1σ error bars and the best-fit Gaussian function in orange. In each panel we show the complete frequency coverage (1.875 MHz) of the SPW where the emission line candidate is detected. The spectral resolution for each spectrum was chosen to best highlight the detection in each case. A2744-EL01 is identified tentatively as CO(8–7) at z = 2.61975 ± 0.0003, MASCJ0416-EL01 has no identification and MACSJ 0416-EL03 is identified tentatively as CO(7–6) at z = 1.96016 ± 0.00003.
Current usage metrics show cumulative count of Article Views (full-text article views including HTML views, PDF and ePub downloads, according to the available data) and Abstracts Views on Vision4Press platform.
Data correspond to usage on the plateform after 2015. The current usage metrics is available 48-96 hours after online publication and is updated daily on week days.
Initial download of the metrics may take a while.