Fig. 5
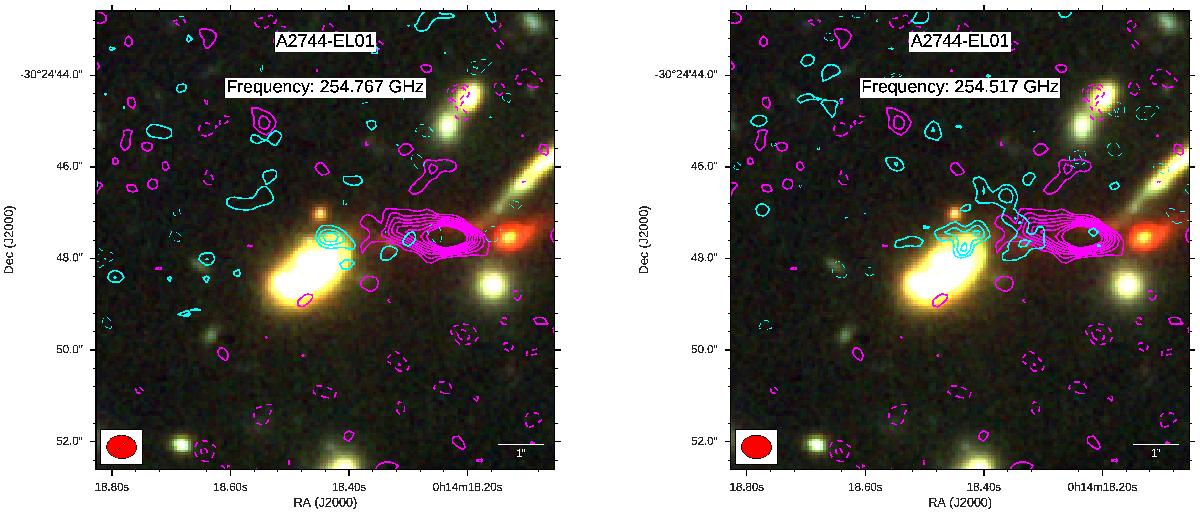
HST color image cutouts for the ALMA-FFs emission line candidate A2744-EL01. Here bands F435W + F060W correspond to blue, F810W + F105W to green, and F125W + F140W + F160W to red. The cyan contours correspond to S/N levels of the ALMA emission line candidate in 1σ steps starting at ±2 times the primary beam corrected noise level at the position of the source. The blue portion of the line is presented in the left panel while the red portion is in the right panel. The continuum 1.1 mm emission is plotted in magenta in steps from ±2σ up to 9σ. The blue portion of the line (left) appears to be unresolved, while the red portion (right) appears to be extended toward the continuum source. In the bottom left corner we show the ALMA synthesized beam of 0.̋63 × 0.̋49 and position angle of 86.̊16.
Current usage metrics show cumulative count of Article Views (full-text article views including HTML views, PDF and ePub downloads, according to the available data) and Abstracts Views on Vision4Press platform.
Data correspond to usage on the plateform after 2015. The current usage metrics is available 48-96 hours after online publication and is updated daily on week days.
Initial download of the metrics may take a while.