Fig. 3
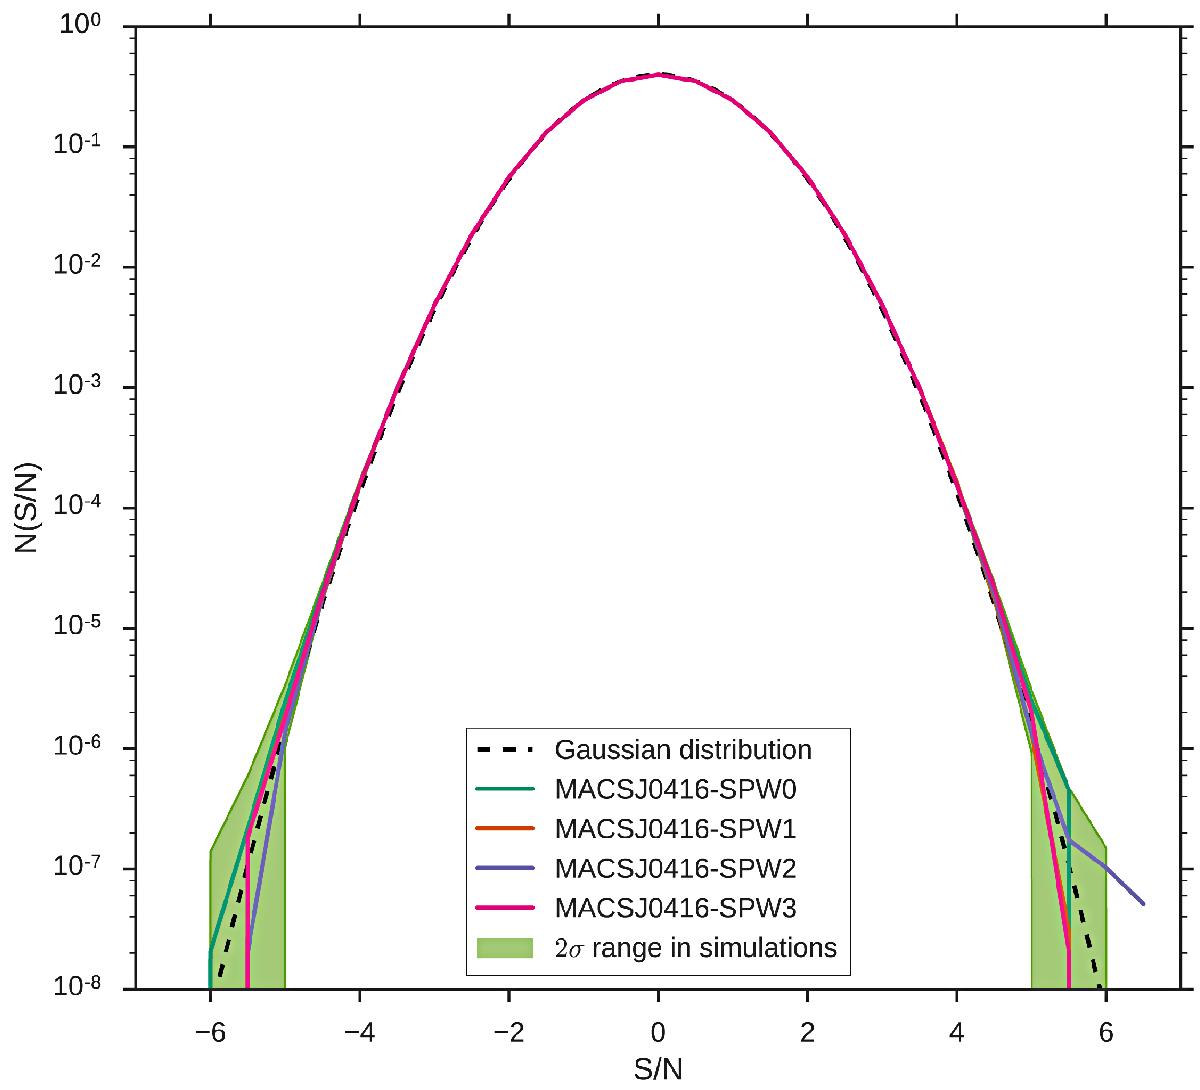
Normalized histogram of the S/N per cell for each of the four SPW cubes in the cluster MACSJ 0416 (solid lines). Similar noise distributions are observed for SPWs associated with the other four clusters. The black dashed curve shows the S/N histogram expected from a pure Gaussian noise distribution, while the green shaded regions correspond to the 95% range based on over 100 simulated SPWs with the same characteristics as the real data. Importantly, while deviations from the perfect Gaussian distribution can be seen above/below roughly ±5σ in the real SPWs, most of these can be explained by small sample size, as the same behavior is observed in the simulations up to S/N = 6. Thus, caution should be used for claims of detections based on positive excesses when reflecting the negative side of the noise distribution as these methods have systematic uncertainties which can over- or underestimate the true significance.
Current usage metrics show cumulative count of Article Views (full-text article views including HTML views, PDF and ePub downloads, according to the available data) and Abstracts Views on Vision4Press platform.
Data correspond to usage on the plateform after 2015. The current usage metrics is available 48-96 hours after online publication and is updated daily on week days.
Initial download of the metrics may take a while.