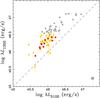
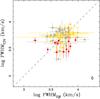
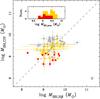
Fig. 6

Comparison of the monochromatic luminosities at 1350 Å and 5100 Å (left, a), the FWHM of the Hβ line and the C ivλ1549 line (middle, b), and virial black hole masses based on the C ivλ1549 line and Hβ line (right, c). Our sample of N-loud quasars are shown as red circles. Gray and yellow circles denote SDSS normal quasars at 1.5 < z < 2.2 in luminosity ranges of log λL1350 > 46.5 and log λL1350 < 46.5 from Shen & Liu (2012). Errors represent 1σ uncertainties of measurements, excluding systematic errors. The one-to-one relations are indicated by dashed lines for each panel.
Current usage metrics show cumulative count of Article Views (full-text article views including HTML views, PDF and ePub downloads, according to the available data) and Abstracts Views on Vision4Press platform.
Data correspond to usage on the plateform after 2015. The current usage metrics is available 48-96 hours after online publication and is updated daily on week days.
Initial download of the metrics may take a while.