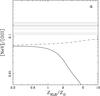
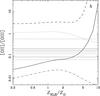
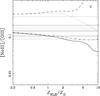
Fig. 5

Model predictions of emission-line flux ratios, i.e., [Ne v]λ3426/[O iii]λ5007 (left, a), [O ii]λ3727/[O iii]λ5007 (middle, b), and [Ne iii]λ3869/[O iii]λ5007 (right, c), as a function of NLR metallicities. Black solid, dashed, dot-dashed, and dotted lines are the photoionization model calculations with (log nH, log U) = (1.0, −1.5), (1.0, −3.5), (4.0, −1.5), and (4.0, −3.5), respectively. The left panel shows only two high-U models because [Ne v]λ3426 line fluxes in low-U models are fainter than the [O iii]λ5007 fluxes. Horizontal lines show the 3σ upper limits of our sample.
Current usage metrics show cumulative count of Article Views (full-text article views including HTML views, PDF and ePub downloads, according to the available data) and Abstracts Views on Vision4Press platform.
Data correspond to usage on the plateform after 2015. The current usage metrics is available 48-96 hours after online publication and is updated daily on week days.
Initial download of the metrics may take a while.