Free Access
Fig. 2

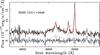
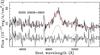
Examples of spectral fittings in rest-frame optical spectra of two N-loud quasars (SDSS J1211+0449 and SDSS J0938+0900). Red lines show total fitting results. Gray dotted lines denote fits of continuum, and individual emission-line components are indicated as light gray Gaussian curves. Dark gray lines denote the residuals.
This figure is made of several images, please see below:
Current usage metrics show cumulative count of Article Views (full-text article views including HTML views, PDF and ePub downloads, according to the available data) and Abstracts Views on Vision4Press platform.
Data correspond to usage on the plateform after 2015. The current usage metrics is available 48-96 hours after online publication and is updated daily on week days.
Initial download of the metrics may take a while.