Fig. 4
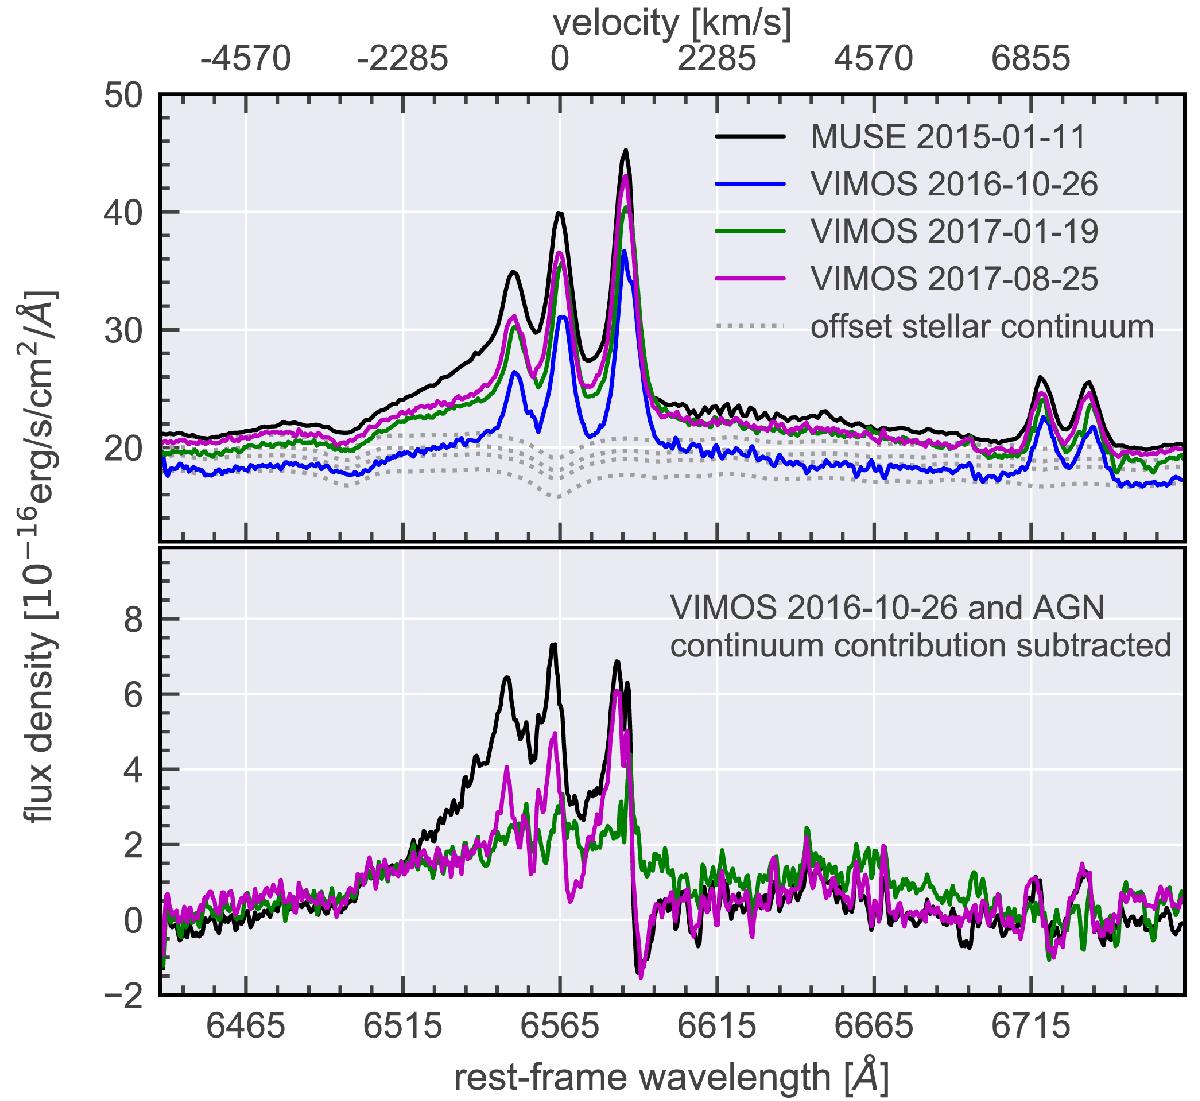
Top: evolution of the broad Hα line of Mrk 1018. Aperture spectra (3′′ diameter) from MUSE and three representative VIMOS IFU observations. Matching offset stellar continua model are shown. Bottom: difference spectra with respect to the minimum spectrum in October 2016. A constant stellar continuum is subtracted in each spectrum, but offset in flux to take the varying AGN continuum emission into account.
Current usage metrics show cumulative count of Article Views (full-text article views including HTML views, PDF and ePub downloads, according to the available data) and Abstracts Views on Vision4Press platform.
Data correspond to usage on the plateform after 2015. The current usage metrics is available 48-96 hours after online publication and is updated daily on week days.
Initial download of the metrics may take a while.