Fig. 1
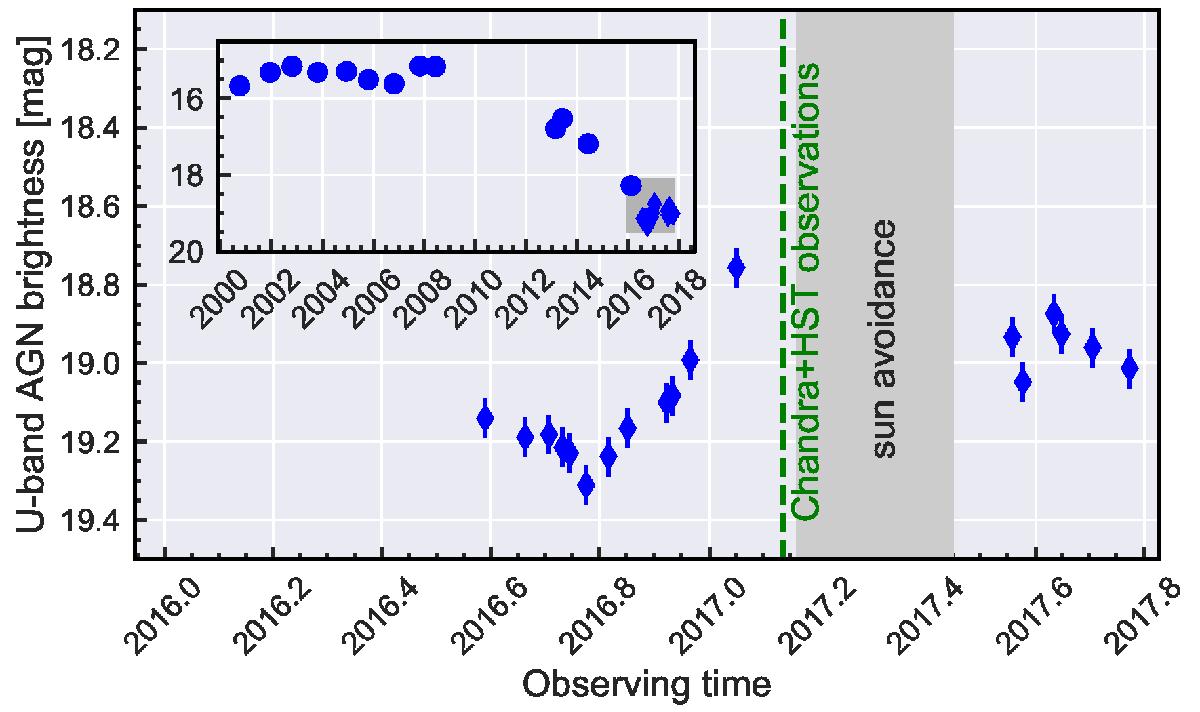
U-band light curve of the AGN nucleus between June 2016 and October 2017 after subtraction of the host galaxy contribution. The inset shows the entire U-band light curve since 2000 for comparison as presented in (McElroy et al. 2016). The gray area in the inset highlights the coverage of the zoom-in axes. The substantial sunblock period in 2017, where it is unobservable, is indicated by the black hatched area. The date of our joint Chandra and HST observation is shown as the green dashed line.
Current usage metrics show cumulative count of Article Views (full-text article views including HTML views, PDF and ePub downloads, according to the available data) and Abstracts Views on Vision4Press platform.
Data correspond to usage on the plateform after 2015. The current usage metrics is available 48-96 hours after online publication and is updated daily on week days.
Initial download of the metrics may take a while.