Fig. 4
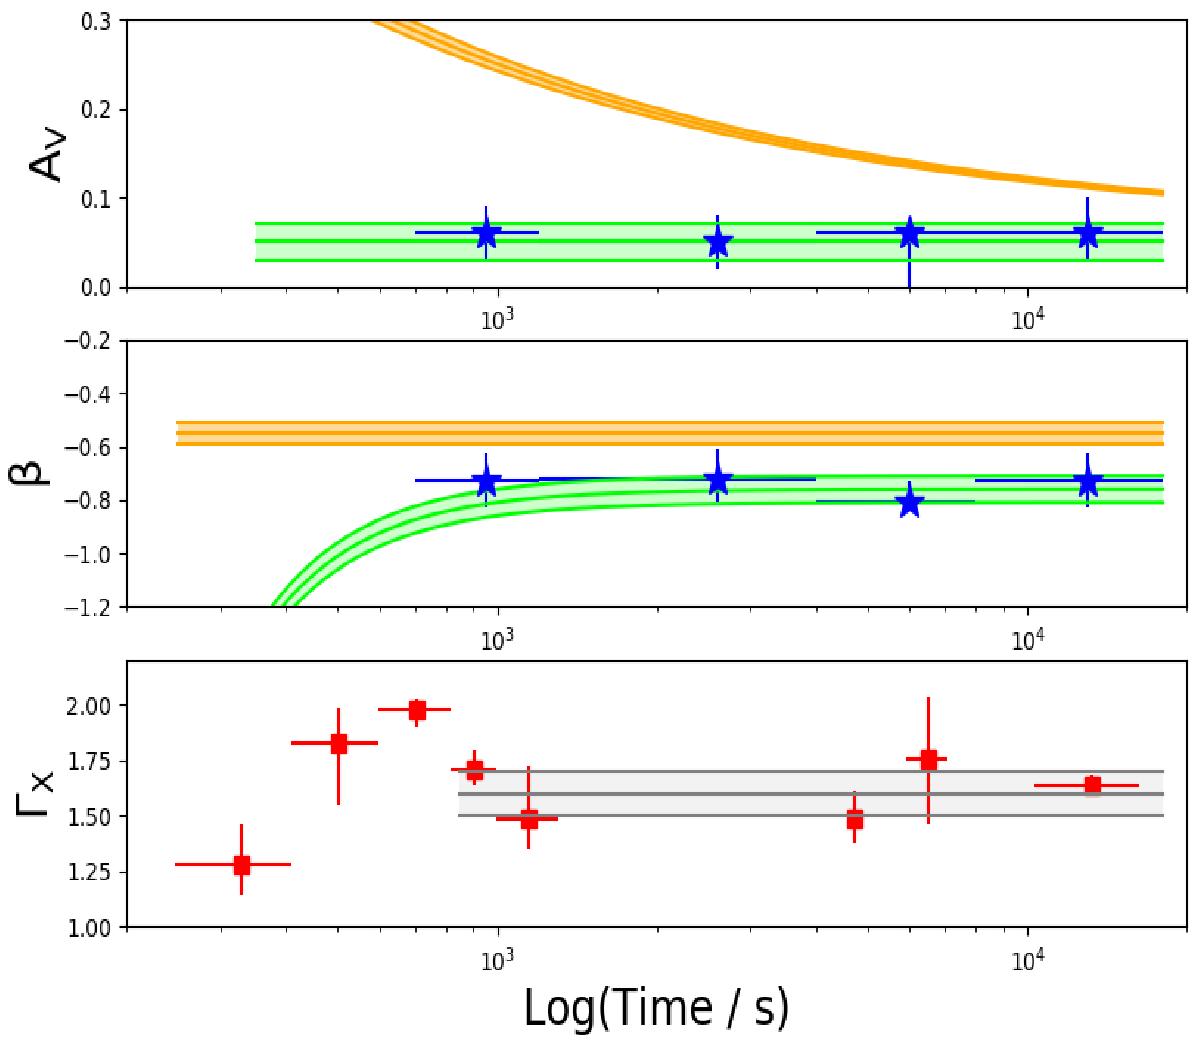
Evolution with time of the spectral parameters. Variation of the optical extinction AV (top) and of the optical spectral index β (centre). Blue stars represent the values obtained by four SEDs as reported in Table 1. The green area refers to the model with AV fixed, while the orange area to the model with β fixed. The red squares (bottom) represent the variation of the X-ray photon index Γ, which at late times settles around the value ~1.6 ± 0.1 (grey area).
Current usage metrics show cumulative count of Article Views (full-text article views including HTML views, PDF and ePub downloads, according to the available data) and Abstracts Views on Vision4Press platform.
Data correspond to usage on the plateform after 2015. The current usage metrics is available 48-96 hours after online publication and is updated daily on week days.
Initial download of the metrics may take a while.